
Tổng quan
Chiến lược này là một hệ thống giao dịch thông minh dựa trên nhiều chỉ số kỹ thuật, kết hợp ba chỉ số kỹ thuật Bollinger Bands, Stochastic Oscillator và Average True Rate (ATR) để xác định cơ hội giao dịch tiềm năng thông qua phân tích tổng hợp về biến động, động lực và xu hướng thị trường. Chiến lược này sử dụng thiết lập mục tiêu dừng lỗ và lợi nhuận động, có thể tự điều chỉnh tham số giao dịch theo biến động của thị trường.
Nguyên tắc chiến lược
Lập luận cốt lõi của chiến lược này dựa trên cơ chế xác minh ba lần:
- Sử dụng Brin Band để xác định phạm vi biến động giá, xác định cơ hội bán tháo khi giá phá vỡ Brin Band xuống đường và xác định cơ hội mua tháo khi giá phá vỡ đường
- Xác nhận động lực bằng các chỉ số ngẫu nhiên ở khu vực mua quá mức ((> 80) và khu vực bán quá mức ((< 20), giao thoa của đường %K và đường %D làm tín hiệu mua vào
- Tiếp tục giới thiệu chỉ số ATR như một bộ lọc biến động để đảm bảo giao dịch được hỗ trợ bởi sự biến động của thị trường
Tạo ra tín hiệu giao dịch cần đáp ứng các điều kiện sau:
Điều kiện mua:
- Giá đóng cửa dưới đường giảm của Brin
- Đường %K của chỉ số ngẫu nhiên đi ngang qua đường %D trong khu vực bán tháo
- ATR cao hơn ngưỡng thiết lập, xác nhận đủ biến động thị trường
Điều kiện bán:
- Giá đóng cửa ở trên đường ray của Brin
- Đường %K của chỉ số ngẫu nhiên đi xuống đường %D trong khu vực mua quá mức
- ATR duy trì trên ngưỡng giảm giá, xác nhận giao dịch có hiệu lực
Lợi thế chiến lược
- Xác thực chéo nhiều chỉ số kỹ thuật, tăng đáng kể độ tin cậy của tín hiệu giao dịch
- Đặt mục tiêu dừng lỗ và lợi nhuận động, điều chỉnh các tham số quản lý rủi ro tự động theo biến động của thị trường
- Cơ chế lọc dao động có hiệu quả trong việc tránh tín hiệu giả trong thời gian dao động thấp
- Các tham số chỉ số có thể được điều chỉnh linh hoạt theo các điều kiện thị trường khác nhau, có khả năng thích ứng tốt
- Chiến lược logic rõ ràng, dễ hiểu và dễ thực hiện, phù hợp với các nhà giao dịch ở mọi cấp
Rủi ro chiến lược
- Có thể có điểm trượt khi thị trường biến động mạnh, ảnh hưởng đến giá thực hiện
- Việc sử dụng nhiều chỉ số có thể gây ra sự chậm trễ tín hiệu và bỏ lỡ thời điểm xuất phát tốt nhất.
- Tối ưu hóa tham số quá mức có thể dẫn đến quá phù hợp, ảnh hưởng đến hiệu suất của chiến lược trong thực tế
- Các công cụ phân tích khác cần được sử dụng cho các tín hiệu giả có thể xuất hiện tại các điểm chuyển hướng.
- Chi phí giao dịch và hoa hồng có thể ảnh hưởng đến hiệu suất thu nhập tổng thể của chiến lược
Hướng tối ưu hóa chiến lược
- Tiến hành bộ lọc xu hướng, như hệ thống chéo trung bình di chuyển, để tăng cường xác nhận xu hướng
- Tối ưu hóa cơ chế điều chỉnh động của ATR để thích ứng tốt hơn với các điều kiện thị trường khác nhau
- Tăng xác thực các chỉ số giao dịch, tăng độ tin cậy của tín hiệu giao dịch
- Tạo ra các tham số thích ứng để tự động điều chỉnh các tham số chỉ số theo tình trạng thị trường
- Thêm bộ lọc thời gian để tránh giao dịch trong thời gian mở và đóng cửa khi thị trường có biến động lớn
Tóm tắt
Chiến lược này xây dựng một hệ thống giao dịch hoàn chỉnh thông qua việc sử dụng kết hợp của Brinband, chỉ số ngẫu nhiên và ATR. Ưu điểm của chiến lược là xác minh chéo và quản lý rủi ro động của nhiều chỉ số, nhưng cũng cần chú ý đến các vấn đề về tối ưu hóa tham số và thích ứng với môi trường thị trường. Bằng cách tối ưu hóa và hoàn thiện liên tục, chiến lược này có khả năng đạt được lợi nhuận ổn định trong giao dịch thực tế.
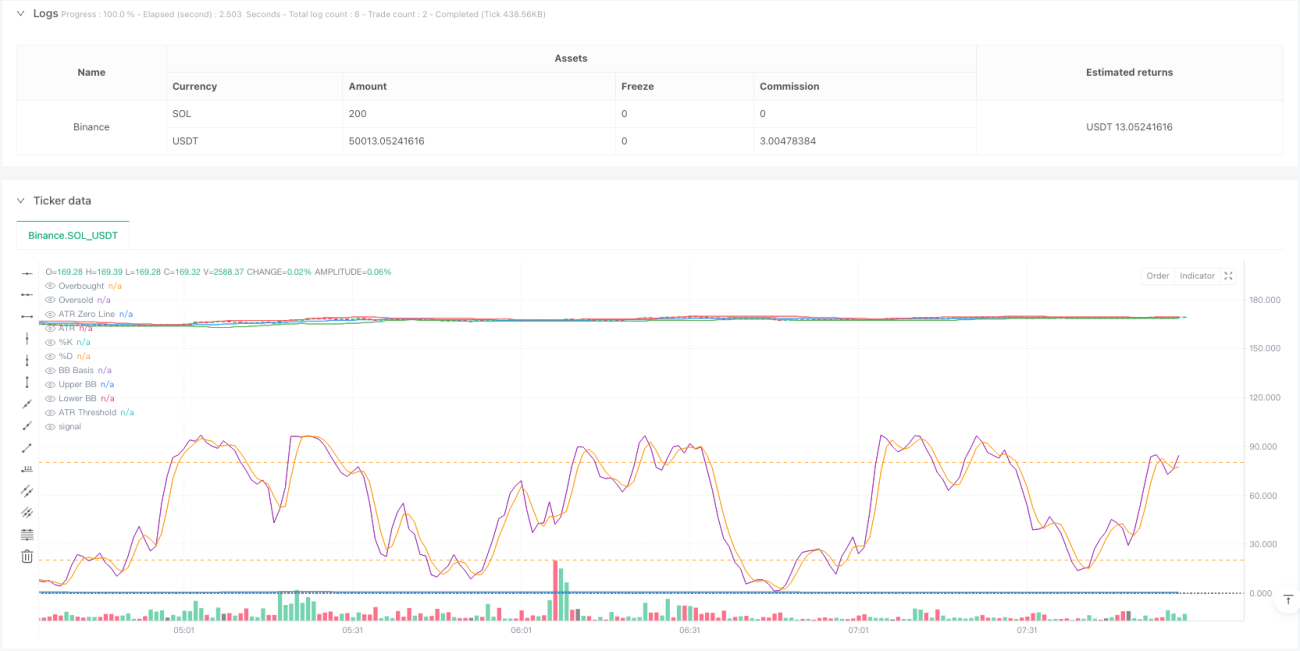
/*backtest
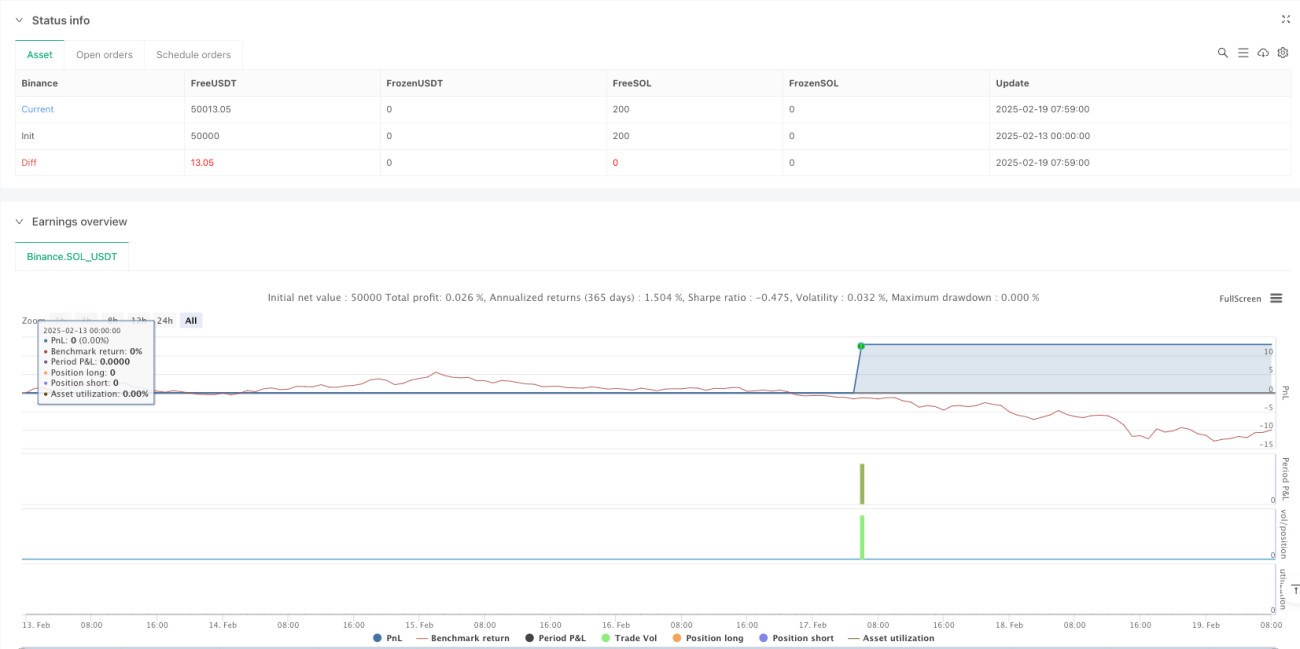
start: 2025-02-13 00:00:00
end: 2025-02-19 08:00:00
period: 1m
basePeriod: 1m
exchanges: [{"eid":"Binance","currency":"SOL_USDT"}]
*/
//@version=5
strategy("Bollinger Bands + Stochastic Oscillator + ATR Strategy", overlay=true, default_qty_type=strategy.percent_of_equity, default_qty_value=10)
// Bollinger Bands Parameters- 1