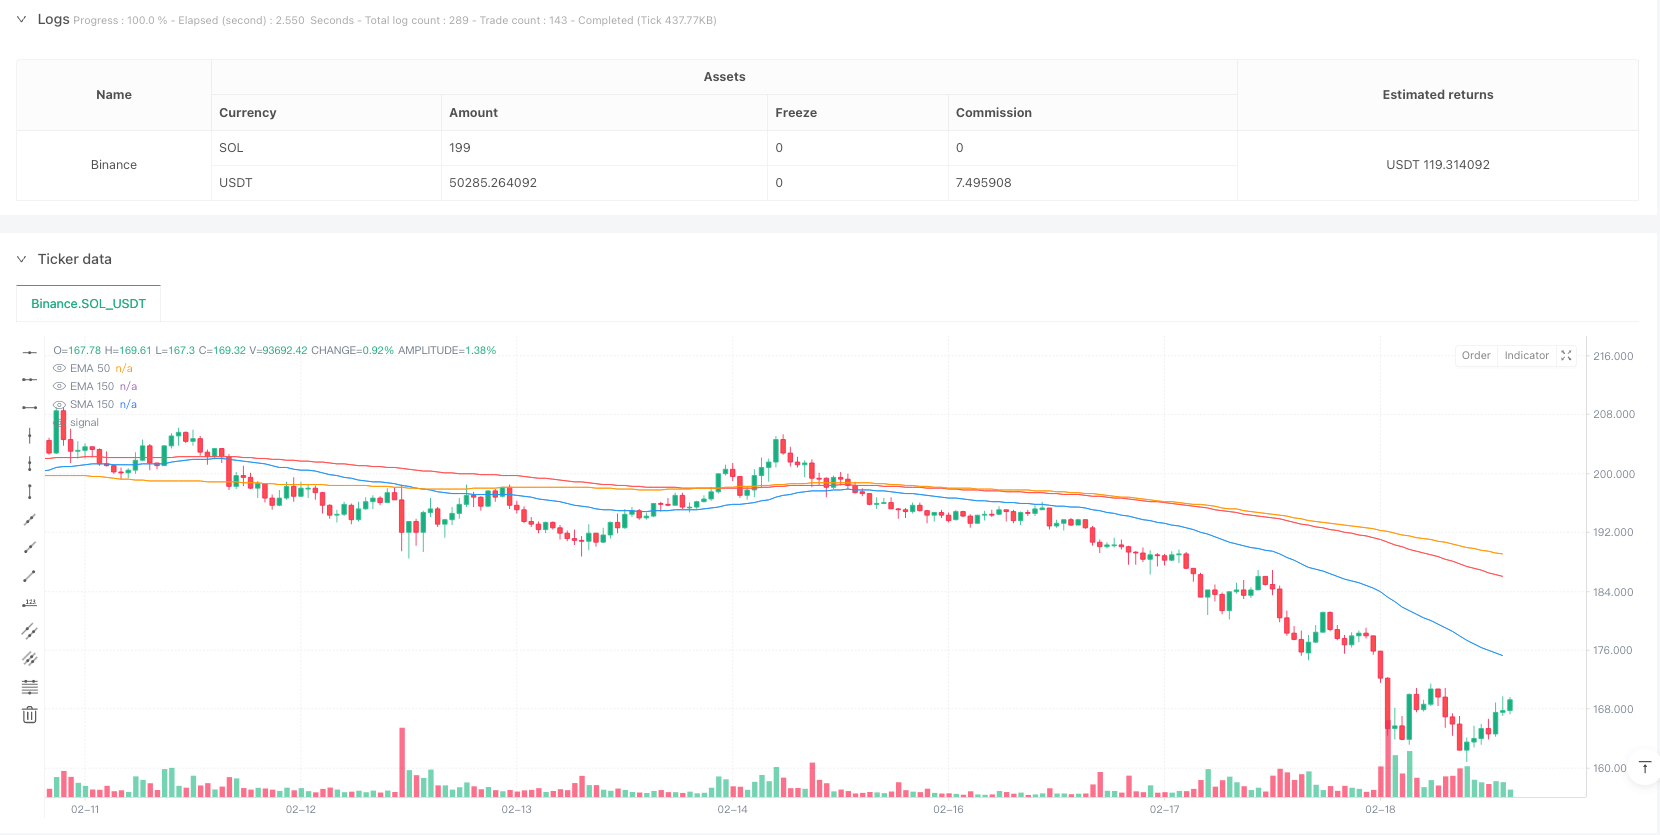
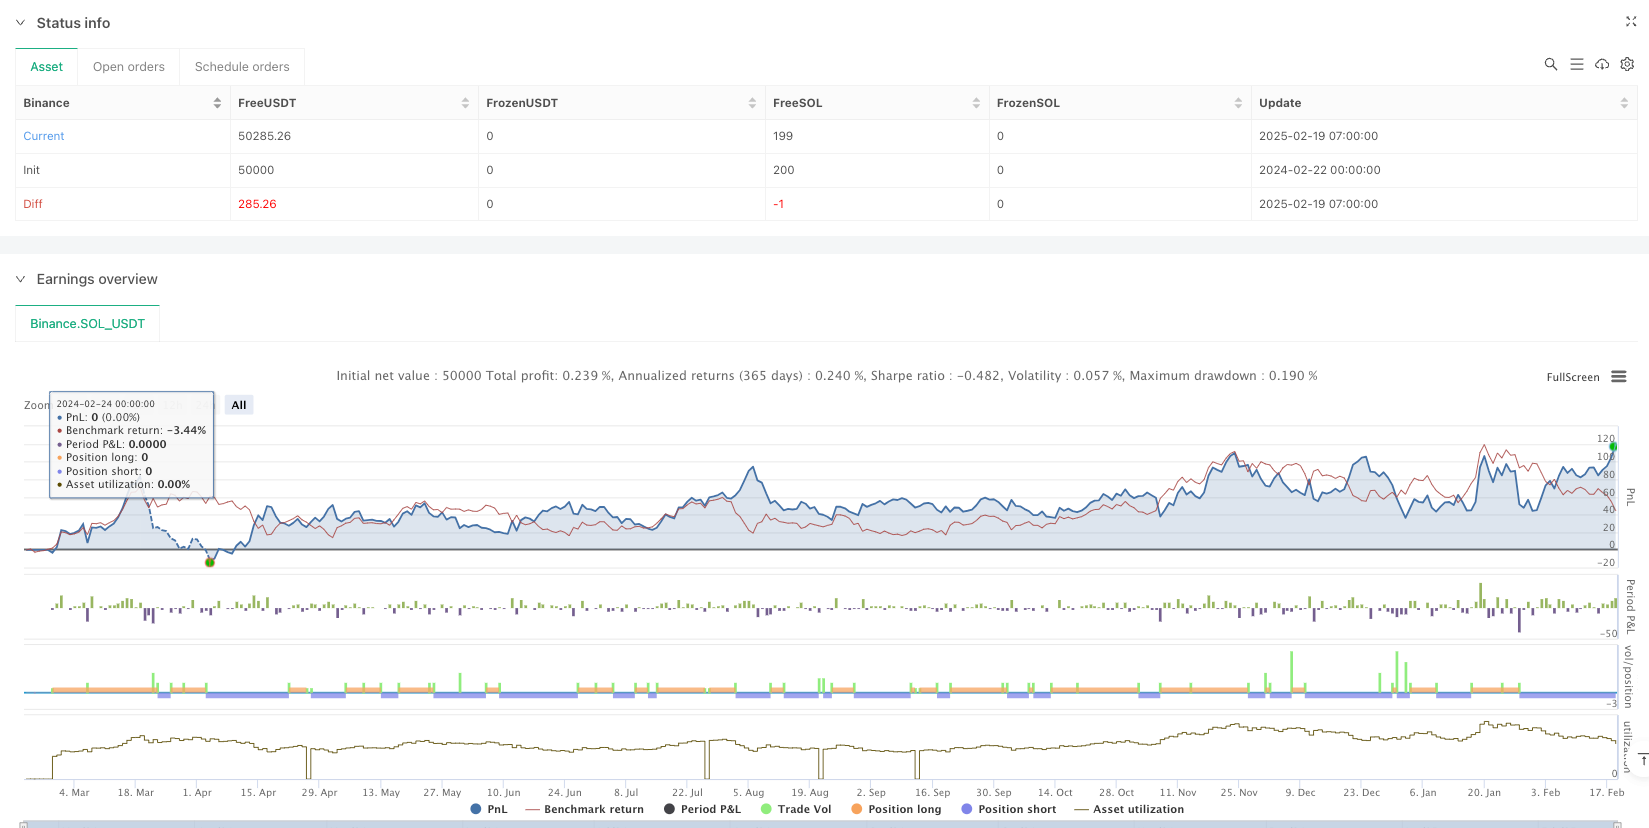
Tổng quan
Chiến lược này là một hệ thống giao dịch theo dõi xu hướng kết hợp các đường trung bình di chuyển chỉ số (EMA) và đường trung bình di chuyển đơn giản (SMA). Chiến lược chủ yếu sử dụng EMA50 và EMA150 để tạo ra tín hiệu giao dịch, đồng thời sử dụng SMA150 làm đường dừng lỗ và bao gồm cơ chế nhập lại sau khi dừng lỗ. Thiết kế này có thể nắm bắt xu hướng trung hạn và dài hạn và kiểm soát rủi ro hiệu quả.
Nguyên tắc chiến lược
Logic cốt lõi của chiến lược bao gồm các yếu tố chính sau:
- Tín hiệu nhập cảnh: Khi EMA50 đi lên qua EMA150, tạo ra tín hiệu làm nhiều; Khi EMA50 đi xuống qua EMA150, tạo ra tín hiệu làm trống.
- Cơ chế dừng lỗ: kích hoạt lệnh dừng lỗ khi giá giảm xuống SMA 150
- Cơ chế tái nhập: Sau khi kích hoạt dừng lỗ, nếu giá vượt qua EMA150 một lần nữa, hãy tái nhập nhiều hơn; Nếu EMA50 đi xuống EMA150 một lần nữa, hãy vào trống.
- Thực hiện giao dịch: Chiến lược thực hiện giao dịch trong khoảng thời gian được chỉ định và tính đến phí 0.1% và điểm trượt 3 điểm.
Lợi thế chiến lược
- Khả năng theo dõi xu hướng mạnh mẽ: có thể nắm bắt được xu hướng thị trường hiệu quả bằng cách sử dụng kết hợp đường trung bình của các chu kỳ khác nhau.
- Kiểm soát rủi ro tốt: thiết lập các điều kiện dừng lỗ rõ ràng để tránh tổn thất quá lớn.
- Cơ chế tái gia nhập linh hoạt: cho phép tái gia nhập khi điều kiện thị trường cải thiện, tăng cơ hội kiếm tiền.
- Các tham số được thiết lập hợp lý: EMA50 và EMA150 được lựa chọn để cân bằng giữa độ nhạy và độ ổn định.
- Xem xét chi phí giao dịch thực tế: bao gồm các yếu tố hoa hồng và điểm trượt, gần gũi hơn với môi trường giao dịch thực tế
Rủi ro chiến lược
- Rủi ro thị trường chấn động: Trong thị trường chấn động ngang có thể thường xuyên tạo ra tín hiệu phá vỡ giả.
- Rủi ro bị tụt hậu: Chỉ số trung bình di chuyển tự nó bị tụt hậu, có thể bỏ lỡ thời điểm tốt nhất để nhập học.
- Rủi ro tái gia nhập: Trong thị trường biến động mạnh, cơ chế tái gia nhập có thể dẫn đến tổn thất liên tục.
- Rủi ro quản lý tiền: Chiến lược không bao gồm chương trình quản lý vị trí cụ thể.
- Tùy thuộc vào môi trường thị trường: Chiến lược có thể có sự khác biệt lớn trong hoạt động của các chu kỳ thị trường khác nhau.
Hướng tối ưu hóa chiến lược
- Tiếp theo, bạn có thể thêm ATR hoặc Bollinger Bands để điều chỉnh vị trí dừng lỗ và làm cho dừng lỗ thích ứng hơn.
- Cải thiện quản lý vị thế: đề xuất thêm hệ thống quản lý vị thế động dựa trên tỷ lệ biến động.
- Tối ưu hóa điều kiện tái nhập: có thể kết hợp với các chỉ số dao động như RSI để cải thiện độ chính xác của tín hiệu tái nhập.
- Tăng bộ lọc môi trường thị trường: Thêm chỉ số cường độ xu hướng, giảm tần suất giao dịch trong thị trường xu hướng thấp.
- Phát triển tham số thích ứng: có thể điều chỉnh chu kỳ trung bình theo biến động của thị trường.
Tóm tắt
Đây là một chiến lược theo dõi xu hướng được thiết kế hợp lý, nắm bắt xu hướng thông qua đường chéo đồng nhất và được trang bị cơ chế kiểm soát rủi ro hoàn hảo. Ưu điểm chính của chiến lược là khả năng theo dõi xu hướng của hệ thống và thiết kế quản lý rủi ro, nhưng trong ứng dụng thực tế, cần chú ý đến ảnh hưởng của môi trường thị trường đối với hiệu suất chiến lược.
/*backtest
start: 2024-02-22 00:00:00
end: 2025-02-19 08:00:00
period: 1h
basePeriod: 1h
exchanges: [{"eid":"Binance","currency":"SOL_USDT"}]
*/

//@version=6
strategy("EMA 50 and EMA 150 with SMA150 Stop-loss and Re-Entry #ganges", overlay=true, commission_type=strategy.commission.percent, commission_value=0.1, slippage=3)


// EMA and SMA Calculations
ema50 = ta.ema(close, 50)
ema150 = ta.ema(close, 150)
sma150 = ta.sma(close, 150)

// Conditions for Buy, Sell, and Stop-Loss
ema50CrossAboveEMA150 = ta.crossover(ema50, ema150)  // Buy signal
ema50CrossBelowEMA150 = ta.crossunder(ema50, ema150) // Sell signal
priceCrossAboveEMA150 = ta.crossover(close, ema150) // Price crosses EMA 150 from below
priceCloseBelowSMA150 = close < sma150              // Stop-loss for long positions


// Track stop-loss hit state
var bool stopLossHit = false

// Strategy Logic
// Buy Logic: EMA 50 crosses EMA 150 from below
if ema50CrossAboveEMA150
    strategy.entry("Buy Signal", strategy.long, qty=1)
    stopLossHit := false // Reset stop-loss state when a new buy position is opened

// Sell Logic: EMA 50 crosses EMA 150 from above
if ema50CrossBelowEMA150
    strategy.entry("Sell Signal", strategy.short, qty=1)
    stopLossHit := false // Reset stop-loss state when a new sell position is opened

// Stop-Loss for Long Positions: Close if price falls below SMA 150
if strategy.position_size > 0 and priceCloseBelowSMA150
    strategy.close("Buy Signal")
    stopLossHit := true // Mark stop-loss hit

// Re-Entry Logic After Stop-Loss
if stopLossHit
    if priceCrossAboveEMA150 // Re-buy logic: PRICE crosses EMA 150 from below
        strategy.entry("Re-Buy Signal", strategy.long, qty=1)
        stopLossHit := false // Reset stop-loss state after re-entry
    if ema50CrossBelowEMA150 // Re-sell logic: EMA 50 crosses EMA 150 from above
        strategy.entry("Re-Sell Signal", strategy.short, qty=1)
        stopLossHit := false // Reset stop-loss state after re-entry

// Plot EMA and SMA Lines
plot(ema50, color=color.blue, title="EMA 50")
plot(ema150, color=color.red, title="EMA 150")
plot(sma150, color=color.orange, title="SMA 150")


// // Calculate Recent All-Time High
// highestHigh = ta.highest(high, 500) // Lookback period of 500 bars
// percentageFall = ((highestHigh - close) / highestHigh) * 100

// // Display Percentage Fall on the Most Recent Candle Only
// isLastBar = bar_index == ta.max(bar_index)
// if isLastBar
//     labelText = str.tostring(percentageFall, "#.##") + "% Fall from ATH"
//     labelPosition = high + ta.atr(14) * 2 // Positioning label above the candle
//     label.new(bar_index, labelPosition, labelText, color=color.red, textcolor=color.white, size=size.small, style=label.style_label_down)