
2
Follow
478
Followers
Tổng quan
Chiến lược này là một hệ thống giao dịch lọc kép kết hợp RSI (chỉ số tương đối mạnh) và đường trung bình xu hướng. Chiến lược này giao dịch ở cấp độ đường mặt trời thông qua tín hiệu mua bán quá mức của RSI kết hợp với đường trung bình xu hướng dài.
Nguyên tắc chiến lược
Chiến lược này dựa trên các thành phần cốt lõi sau:
- Chỉ số RSI được sử dụng để xác định các khu vực quá mua quá bán, mặc định là 14 chu kỳ
- Cài đặt mức mua quá mức 70 và mức bán quá mức 30
- 200 chu kỳ trung bình di chuyển đơn giản như một bộ lọc xu hướng
- Điều kiện mua: RSI vượt khỏi vùng oversold và giá nằm trên đường trung bình
- Điều kiện bán ra: RSI phá vỡ từ vùng quá mua và giá nằm dưới đường trung bình
Chiến lược tự động thực hiện giao dịch khi mỗi tín hiệu xuất hiện và có thể cấu hình chức năng nhắc nhở.
Lợi thế chiến lược
- Cơ chế xác nhận kép giúp tăng đáng kể độ tin cậy của giao dịch
- Kết hợp các chỉ số xu hướng và động lực để giảm nguy cơ tín hiệu sai
- Hệ thống thực hiện giao dịch hoàn toàn tự động
- Cài đặt tham số linh hoạt cho phép tối ưu hóa chính sách
- Tích hợp thông tin nhắc nhở trong thời gian thực, cho phép bạn thực hiện các thao tác thực tế
- Giao diện trực quan hiển thị rõ ràng tín hiệu giao dịch
- Hỗ trợ tính năng phản hồi để dễ dàng xác minh chiến lược
Rủi ro chiến lược
- Thị trường chấn động có thể tạo ra tín hiệu giao dịch thường xuyên
- Điểm chuyển hướng có thể bị trì hoãn
- Cài đặt tham số không phù hợp có thể ảnh hưởng đến hiệu suất chiến lược
- Những biến động cực đoan của thị trường có thể gây ra sự rút lui lớn hơn
Các biện pháp quản lý rủi ro được đề xuất như sau:
- Đặt điểm dừng lỗ hợp lý
- Điều chỉnh kích thước vị trí phù hợp
- Thường xuyên tối ưu hóa các tham số chính sách
- Kết hợp với các chỉ số kỹ thuật khác để hỗ trợ phán đoán
Hướng tối ưu hóa chiến lược
- Thêm bộ lọc biến động, điều chỉnh tiêu chuẩn giao dịch trong thời gian biến động cao
- Giới thiệu cơ chế tham số thích ứng, điều chỉnh các tham số theo tình trạng thị trường động
- Thêm cơ chế xác nhận âm lượng để cải thiện độ tin cậy của tín hiệu
- Phát triển cơ chế ra sân phức tạp hơn, tối ưu hóa thời gian kết thúc
- Tích hợp phân tích nhiều chu kỳ thời gian để cung cấp cái nhìn toàn diện hơn về thị trường
Tóm tắt
Chiến lược này xây dựng một hệ thống giao dịch ổn định bằng cách kết hợp RSI và đường ngang của xu hướng. Chiến lược được thiết kế hợp lý, quy tắc hoạt động rõ ràng và có khả năng thực tiễn tốt. Với quản lý rủi ro hợp lý và tối ưu hóa liên tục, chiến lược này có thể đạt được lợi nhuận ổn định trong giao dịch thực tế.
Source
Pine
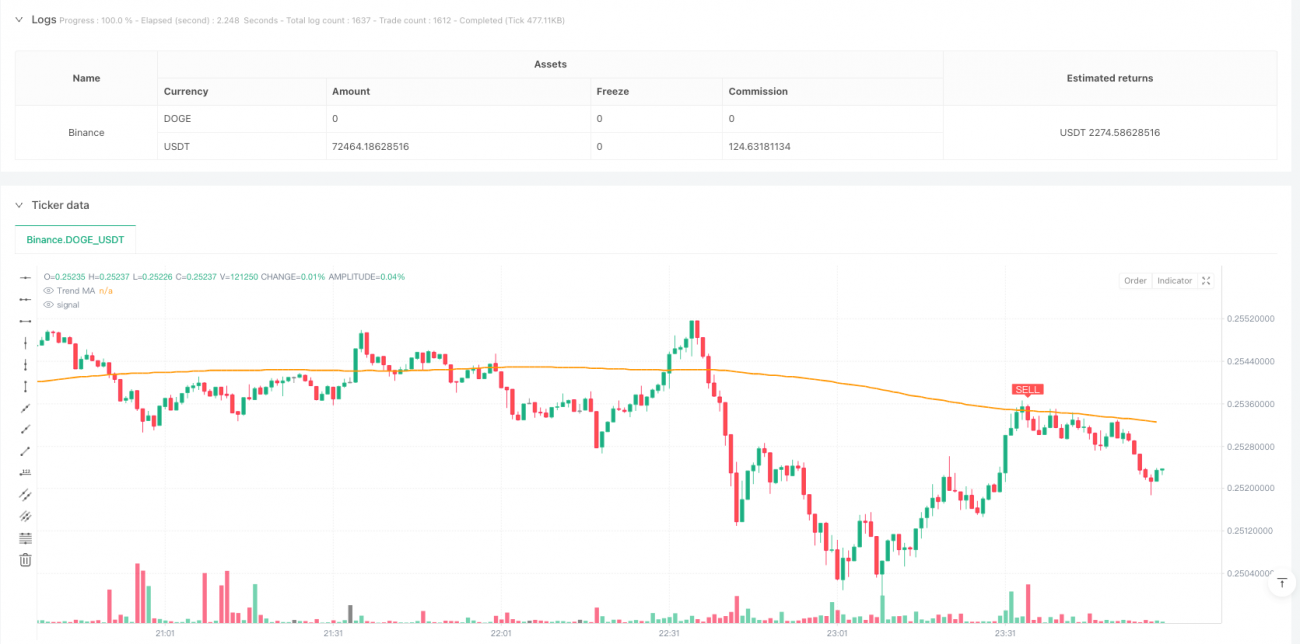
/*backtest
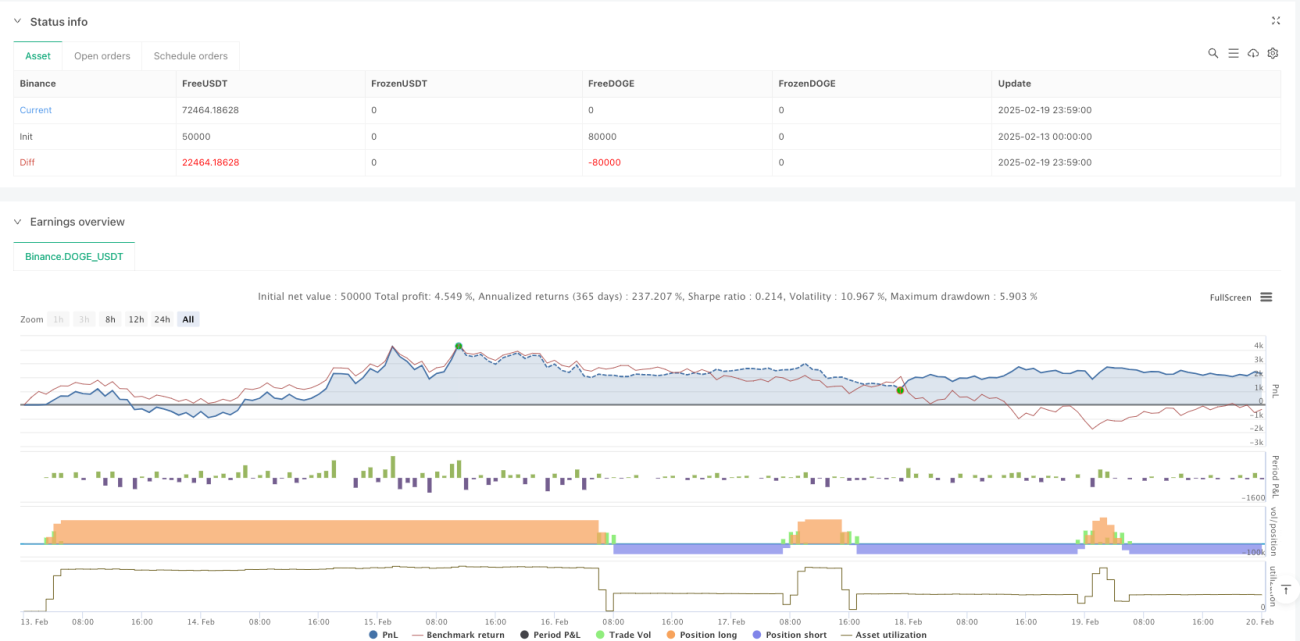
start: 2025-02-13 00:00:00
end: 2025-02-20 00:00:00
period: 1m
basePeriod: 1m
exchanges: [{"eid":"Binance","currency":"DOGE_USDT"}]
*/
//@version=5
strategy("Leading Indicator Strategy – Daily Signals", overlay=true,
pyramiding=1, initial_capital=100000,
default_qty_type=strategy.percent_of_equity, default_qty_value=100)Strategy parameters
Related strategies
Comment
All comments (0)
No data
- 1