Chiến lược tối ưu hóa cơ chế giao dịch chỉ báo Supertrend nâng cao

2
Follow
478
Followers
Tổng quan
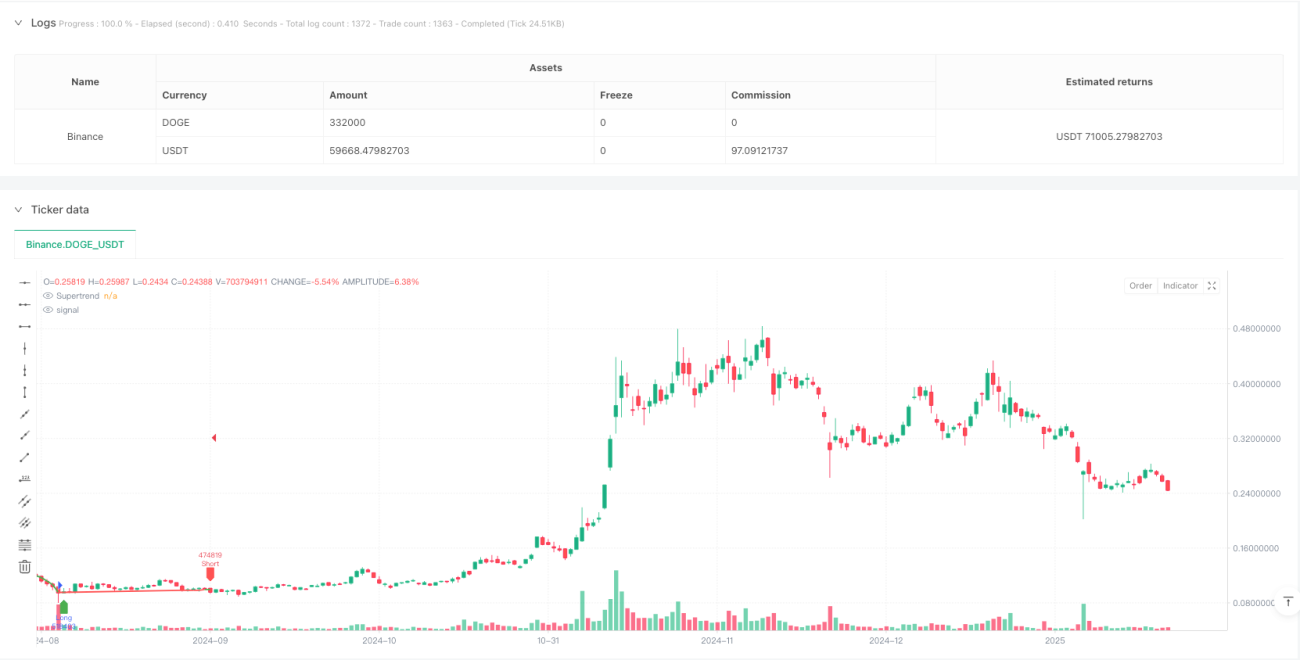
Chiến lược này là một hệ thống giao dịch cao cấp dựa trên chỉ số siêu xu hướng (Supertrend) để xác định các tín hiệu mua và bán thị trường thông qua việc phân tích hành vi thay đổi xu hướng và hành vi giá. Chiến lược này sử dụng cơ chế theo dõi xu hướng động, kết hợp với xác minh giá phá vỡ, có thể nắm bắt hiệu quả các điểm biến đổi xu hướng thị trường.
Nguyên tắc chiến lược
Cốt lõi của chiến lược này dựa trên các yếu tố chính sau:
- Sử dụng chỉ số siêu xu hướng làm công cụ định xu hướng chính, tham số được đặt thành chiều dài 6 và nhân 0,25
- Để nắm bắt cơ hội giao dịch tiềm năng bằng cách theo dõi sự thay đổi về hướng của xu hướng siêu
- Sử dụng cơ chế xác nhận giá phá vỡ, yêu cầu giá đóng cửa phá vỡ đường xu hướng để kích hoạt tín hiệu giao dịch
- Trong một xu hướng tăng, khi giá vượt qua đường xu hướng, bạn sẽ làm nhiều hơn.
- Trong một xu hướng giảm giá, khi giá phá vỡ đường vượt quá xu hướng dưới
- Sử dụng cơ chế thoát theo dõi xu hướng động, cân bằng theo tín hiệu đảo ngược
Lợi thế chiến lược
- Cơ chế xác nhận xu hướng có thể giảm hiệu quả tín hiệu giả và tăng độ chính xác giao dịch
- Kết hợp với phân tích hành vi giá, tăng cường độ tin cậy của tín hiệu
- Hiển thị tín hiệu trực quan rõ ràng giúp các nhà giao dịch nhanh chóng nhận ra cơ hội giao dịch
- Kiểm soát rủi ro tốt hơn bằng cách quản lý tỷ lệ phần trăm
- Hệ thống cảnh báo được thiết lập để giúp các nhà giao dịch nhận được tín hiệu nhắc nhở kịp thời
- Lập luận chiến lược đơn giản, rõ ràng, dễ hiểu và dễ thực hiện
Rủi ro chiến lược
- Tín hiệu đột phá sai thường xuyên có thể xảy ra trong một thị trường biến động
- Sự chậm trễ của điểm chuyển hướng có thể gây ra sự chậm trễ trong thời gian nhập cảnh
- Cài đặt tham số cố định có thể không phù hợp với tất cả các môi trường thị trường
- Cơ chế điều chỉnh động không tính đến sự biến động của thị trường
- Thiếu cơ chế dừng lỗ có thể gây ra tổn thất lớn trong biến động mạnh
- Sự phụ thuộc vào chỉ số duy nhất có thể bỏ qua các thông tin thị trường quan trọng khác
Hướng tối ưu hóa chiến lược
- Giới thiệu các chỉ số biến động (như ATR), điều chỉnh động các tham số vượt quá xu hướng
- Thêm nhiều cơ chế xác nhận chu kỳ thời gian để tăng độ tin cậy tín hiệu
- Kết hợp các chỉ số kỹ thuật khác (như RSI hoặc MACD) để lọc tín hiệu
- Phát triển hệ thống quản lý vị trí thích ứng
- Thực hiện cơ chế dừng lỗ động để kiểm soát rủi ro tốt hơn
- Thêm chức năng nhận diện môi trường thị trường, điều chỉnh các tham số chiến lược trong các điều kiện thị trường khác nhau
Tóm tắt
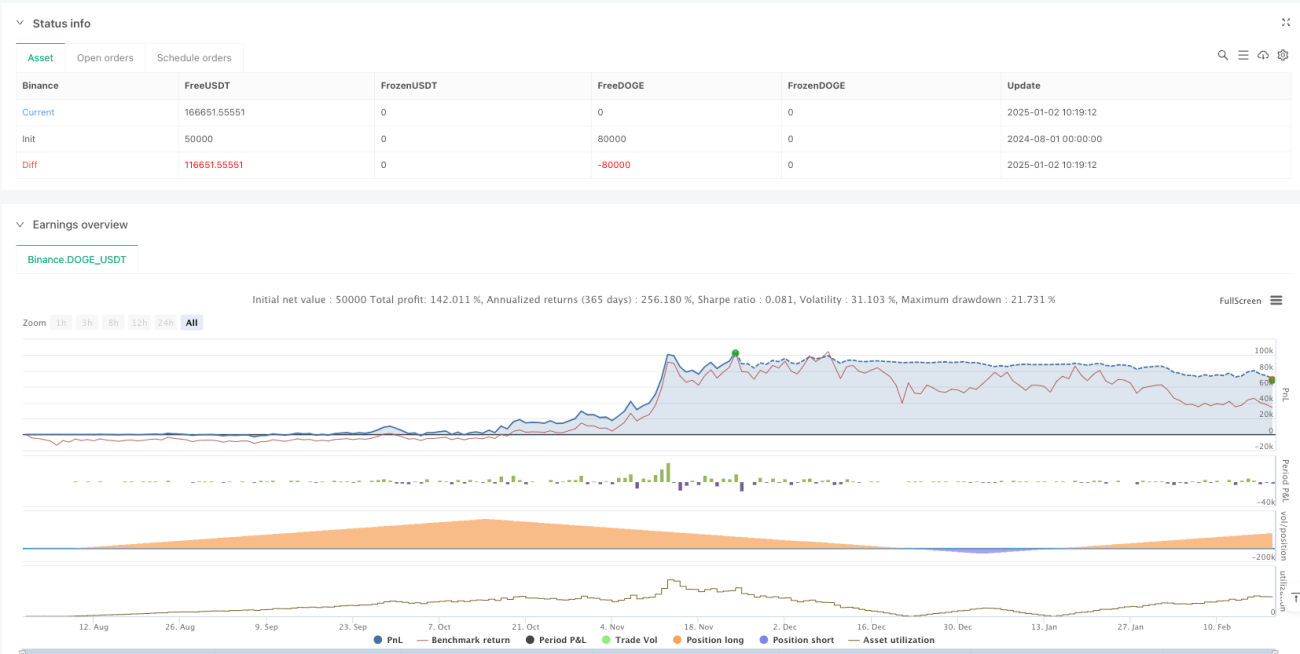
Chiến lược này kết hợp các chỉ số siêu xu hướng và phân tích hành vi giá để xây dựng một hệ thống giao dịch tương đối đáng tin cậy. Mặc dù có một số rủi ro tiềm ẩn, nhưng hướng tối ưu hóa được đề xuất có thể nâng cao hơn nữa sự ổn định và lợi nhuận của chiến lược.
Source
Pine
/*backtest
start: 2024-08-01 00:00:00
end: 2025-02-19 08:00:00
period: 1d
basePeriod: 1d
exchanges: [{"eid":"Binance","currency":"DOGE_USDT"}]
*/

//@version=5
strategy("Supertrend Strategy with Money Ocean Trade", overlay=true, default_qty_type=strategy.percent_of_equity, default_qty_value=100)

// Input parametersStrategy parameters
Related strategies
Comment
All comments (0)
No data
- 1