Tổng quan
Chiến lược này là một hệ thống giao dịch kết hợp các chỉ số crossover bi-homogeneous và tương đối yếu ((RSI)). Chiến lược sử dụng chỉ số chuyển động trung bình 9 chu kỳ và 21 chu kỳ ((EMA) như một công cụ tạo tín hiệu chính, đồng thời giới thiệu chỉ số RSI như một bộ lọc để tránh giao dịch trong khu vực mua / bán quá mức. Phương pháp kết hợp này giữ nguyên đặc điểm theo dõi xu hướng và tăng chiều kích xác nhận động lực.
Nguyên tắc chiến lược
Logic cốt lõi của chiến lược này dựa trên các thành phần chính sau:
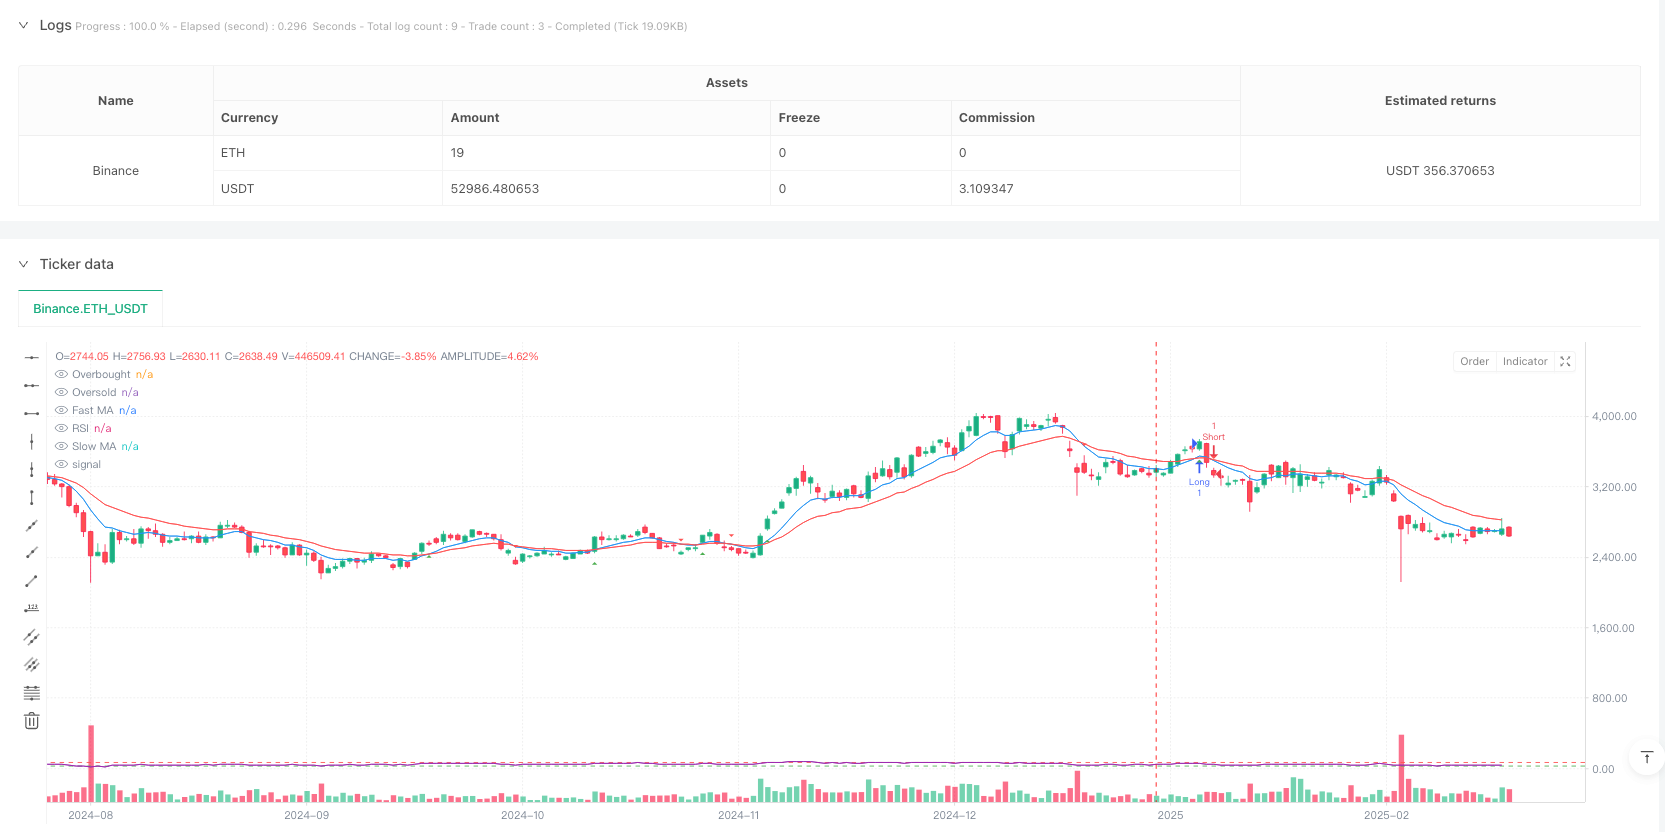
- Tín hiệu chéo giữa EMA nhanh ((9 chu kỳ) và EMA chậm ((21 chu kỳ)
- Chỉ số RSI ((14 chu kỳ) làm bộ lọc, đặt 70 và 30 làm ngưỡng mua và bán quá mức
- Điều kiện mua: EMA nhanh trên EMA chậm và RSI dưới 70
- Điều kiện bán: EMA nhanh dưới EMA chậm và RSI trên 30 Chiến lược này giúp đảm bảo tín hiệu xu hướng được tin cậy và tránh giao dịch khi thị trường quá nóng hoặc quá lạnh.
Lợi thế chiến lược
- Độ tin cậy của tín hiệu: tăng độ tin cậy của tín hiệu giao dịch bằng cách kết hợp các chỉ số hai chiều của xu hướng và động lực
- Kiểm soát rủi ro: Bộ lọc RSI có hiệu quả trong việc tránh giao dịch trong khu vực mua/bán quá mức
- Khả năng thích ứng: Các tham số chiến lược có thể được điều chỉnh theo các điều kiện thị trường khác nhau
- Tự động hóa cao: bao gồm toàn bộ chức năng tạo tín hiệu và nhắc nhở
- Hiển thị hiệu quả: cung cấp giao diện đồ họa rõ ràng, giúp thương nhân hiểu được tình trạng thị trường
Rủi ro chiến lược
- Rủi ro bị tụt hậu: Các đường trung bình di chuyển là một chỉ số bị tụt hậu, có thể gây ra sự chậm trễ trong thị trường biến động nhanh
- Rủi ro phá vỡ giả: Có thể có nhiều tín hiệu phá vỡ giả trong thị trường ngang
- Tính nhạy cảm tham số: hiệu quả chiến lược nhạy cảm với các thiết lập tham số, các môi trường thị trường khác nhau có thể yêu cầu các kết hợp tham số khác nhau
- Tùy thuộc vào môi trường thị trường: hoạt động tốt hơn trong thị trường có xu hướng rõ ràng và có thể hoạt động kém hơn trong thị trường xung đột
Hướng tối ưu hóa chiến lược
- Tham gia chỉ số biến động: Xem xét thêm ATR hoặc Bollinger Bands để thích ứng với môi trường biến động thị trường khác nhau
- Tối ưu hóa lọc tín hiệu: Có thể xem xét thêm chỉ số giao dịch như xác nhận phụ trợ
- Điều chỉnh tham số động: Phát triển hệ thống tham số thích ứng, tự động điều chỉnh tham số chỉ số theo tình trạng thị trường
- Tăng cơ chế dừng lỗ: Thêm chức năng dừng lỗ động, nâng cao khả năng quản lý rủi ro
- Tối ưu hóa khung thời gian: xem xét phân tích nhiều khung thời gian để tăng độ tin cậy tín hiệu
Tóm tắt
Chiến lược này xây dựng một hệ thống giao dịch hoàn chỉnh hơn bằng cách kết hợp các công cụ phân tích kỹ thuật cổ điển. Bằng cách nắm bắt xu hướng chéo bằng đường thẳng, lọc tín hiệu bằng RSI, thực hiện sự kết hợp hữu cơ của theo dõi xu hướng và xác nhận động lực. Ưu điểm chính của chiến lược là khả năng kiểm soát độ tin cậy và rủi ro của nó, nhưng cũng cần chú ý đến sự chậm trễ của đường trung bình di chuyển và sự nhạy cảm của các thiết lập tham số.
/*backtest
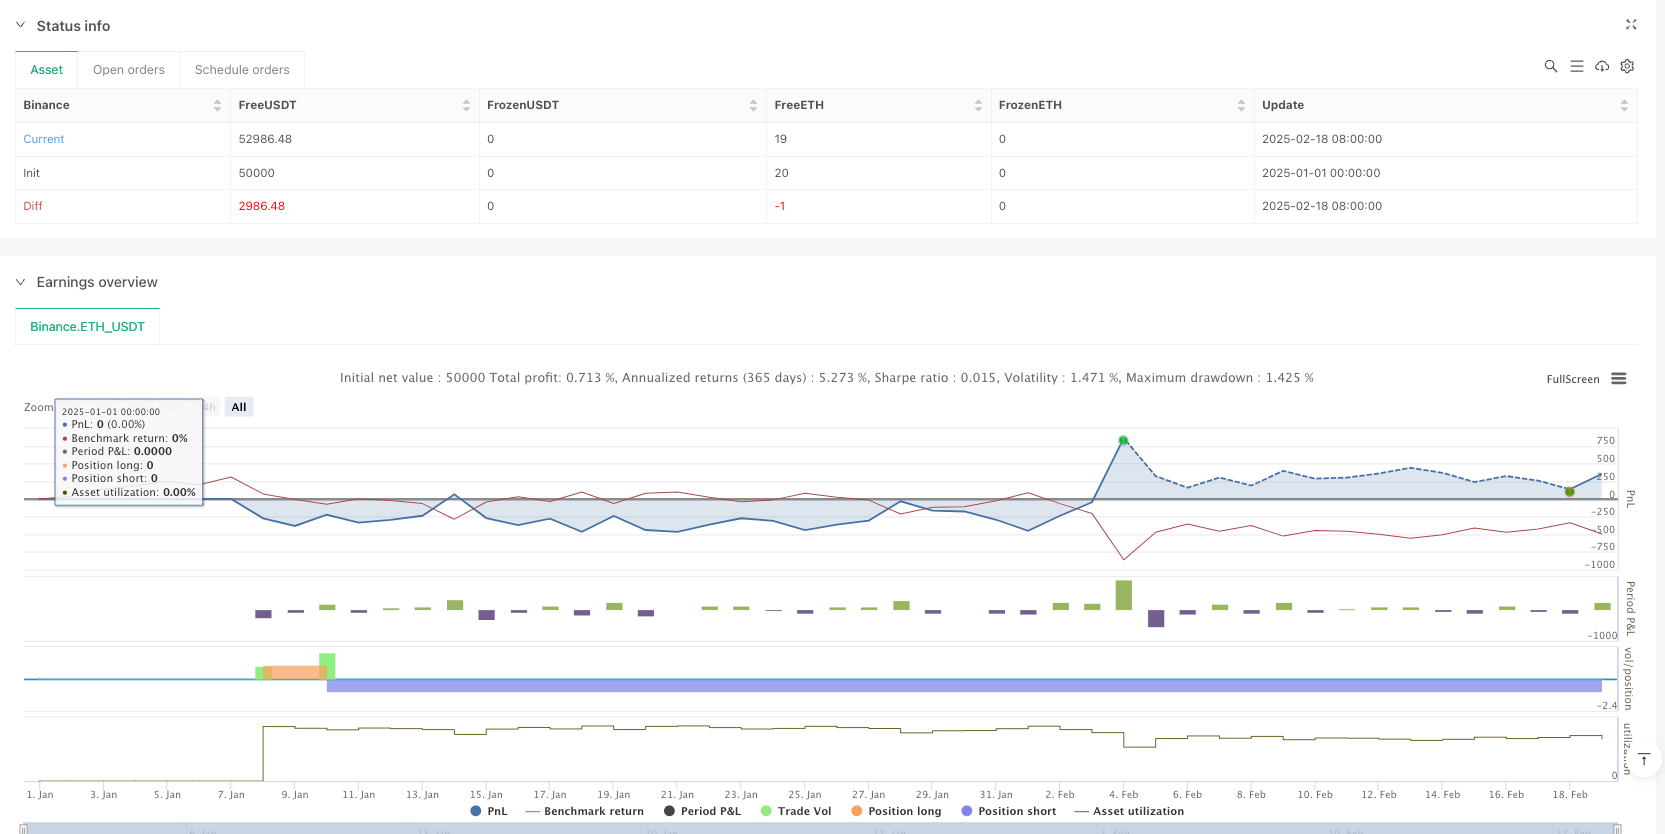
start: 2025-01-01 00:00:00
end: 2025-02-19 08:00:00
period: 1d
basePeriod: 1d
exchanges: [{"eid":"Binance","currency":"ETH_USDT"}]
*/
// This Pine Script™ code is subject to the terms of the Mozilla Public License 2.0 at https://mozilla.org/MPL/2.0/
// © McTunT
// Gold Price Trading Signals
// Pine Script version 6 code for TradingView
//@version=6
strategy("Ausiris Gold Trading Strategy", overlay=true)
// Input parameters
fastLength = input.int(9, title="Fast MA Length", minval=1)
slowLength = input.int(21, title="Slow MA Length", minval=1)
rsiLength = input.int(14, title="RSI Length", minval=1)
rsiOverbought = input.int(70, title="RSI Overbought Level", minval=50, maxval=100)
rsiOversold = input.int(30, title="RSI Oversold Level", minval=0, maxval=50)
// Calculate moving averages
fastMA = ta.ema(close, fastLength)
slowMA = ta.ema(close, slowLength)
// Calculate RSI
rsiValue = ta.rsi(close, rsiLength)
// Plot moving averages
plot(fastMA, color=color.blue, title="Fast MA")
plot(slowMA, color=color.red, title="Slow MA")
// Generate signals
longCondition = ta.crossover(fastMA, slowMA) and rsiValue < rsiOverbought
shortCondition = ta.crossunder(fastMA, slowMA) and rsiValue > rsiOversold
// Plot buy/sell signals
plotshape(longCondition, title="Buy Signal", location=location.belowbar, color=color.green, style=shape.triangleup, size=size.small)
plotshape(shortCondition, title="Sell Signal", location=location.abovebar, color=color.red, style=shape.triangledown, size=size.small)
// Strategy entry/exit
if (longCondition)
strategy.entry("Long", strategy.long)
if (shortCondition)
strategy.entry("Short", strategy.short)
// Add alert conditions
alertcondition(longCondition, title="Buy Alert", message="Gold Buy Signal!")
alertcondition(shortCondition, title="Sell Alert", message="Gold Sell Signal!")
// Display RSI values
hline(rsiOverbought, "Overbought", color=color.red)
hline(rsiOversold, "Oversold", color=color.green)
plot(rsiValue, "RSI", color=color.purple, display=display.none)