Tổng quan
Đây là một chiến lược theo dõi xu hướng dựa trên chỉ số ATR (trung bình phạm vi thực tế) kết hợp với các dấu hiệu dừng động và tín hiệu chéo đường trung bình. Chiến lược này xác định sự biến động của thị trường bằng cách tính toán ATR và sử dụng thông tin này để thiết lập đường dừng động.
Nguyên tắc chiến lược
Lý luận cốt lõi của chiến lược dựa trên một số tính toán quan trọng sau:
- Sử dụng chỉ số ATR để đo lường sự biến động của thị trường, có thể điều chỉnh theo chu kỳ
- Đường dừng động được tính dựa trên giá trị ATR, điều chỉnh bằng tham số nhạy a
- Xây dựng ATR theo dõi đường dừng, điều chỉnh động theo giá di chuyển
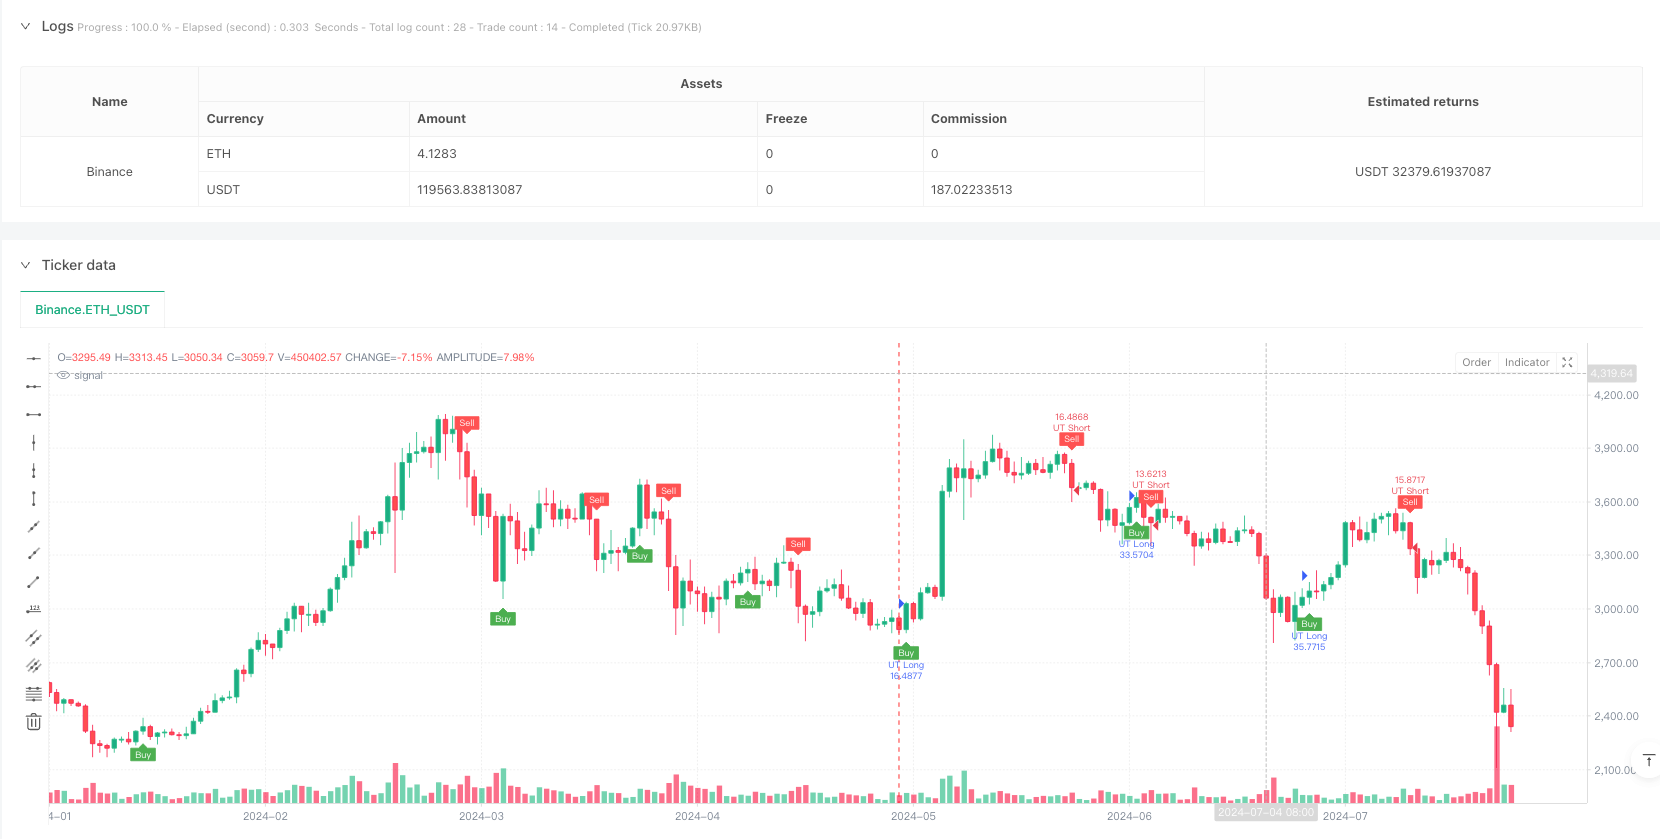
- Sử dụng 1 chu kỳ EMA và ATR theo dõi đường dừng để xác định tín hiệu giao dịch
- Mở nhiều khi EMA vượt qua ATR theo dõi dừng chân lên, mở trống khi vượt qua
- Có thể chọn sử dụng giá đóng cửa thông thường hoặc giá HLC3 của đường K của HCM làm chuẩn tính toán
Lợi thế chiến lược
- Khả năng thích ứng động: ATR theo dõi dừng lỗ có thể tự động điều chỉnh theo biến động của thị trường, cho phép chiến lược duy trì sự ổn định trong các môi trường thị trường khác nhau
- Kiểm soát rủi ro hoàn hảo: Bảo vệ liên tục vị trí thông qua đường dừng động
- Các tham số có thể điều chỉnh tốt: có thể thích ứng với các đặc điểm thị trường khác nhau bằng cách điều chỉnh chu kỳ và độ nhạy của ATR
- Tín hiệu rõ ràng và đáng tin cậy: kết hợp với đường chéo đều cung cấp tín hiệu rõ ràng vào và ra
- Tính đơn giản của logic tính toán: logic chiến lược rõ ràng, dễ hiểu và dễ duy trì
- Hiển thị hiệu quả: cung cấp các tín hiệu giao dịch và biểu hiện đồ họa của xu hướng
Rủi ro chiến lược
- Rủi ro thị trường chấn động: có thể tạo ra các tín hiệu phá vỡ giả thường xuyên trong thị trường chấn động ngang
- Tác động của điểm trượt: Có thể có điểm trượt lớn hơn trong điều kiện nhanh, ảnh hưởng đến hiệu suất chiến lược
- Độ nhạy của tham số: Các kết hợp tham số khác nhau có thể dẫn đến sự khác biệt lớn về hiệu suất chiến lược
- Phụ thuộc vào xu hướng: Chiến lược có thể không hoạt động tốt ở các thị trường không có xu hướng
- Mức độ dừng: ATR bất thường có thể dẫn đến vị trí dừng không hợp lý
Hướng tối ưu hóa chiến lược
- Thêm bộ lọc xu hướng: giới thiệu các chỉ số đánh giá xu hướng bổ sung để giảm tín hiệu giả của thị trường xung đột
- Tự thích ứng các tham số tối ưu hóa: Phát triển cơ chế tự động tối ưu hóa chu kỳ và độ nhạy của ATR
- Cải thiện tín hiệu xác nhận: tăng khối lượng giao dịch hoặc các chỉ số kỹ thuật khác như tín hiệu xác nhận
- Cải thiện cơ chế dừng lỗ: tăng sự kết hợp giữa dừng lỗ cố định và di chuyển dựa trên ATR
- Tăng quản lý vị trí: điều chỉnh quy mô giữ vị trí theo biến động của thị trường
Tóm tắt
Đây là một chiến lược giao dịch hoàn chỉnh kết hợp các hệ thống dừng và đường thẳng theo dõi động. Thu thập các đặc điểm biến động của thị trường thông qua các chỉ số ATR, cung cấp tín hiệu giao dịch bằng cách sử dụng đường thẳng giao dịch, tạo thành một hệ thống giao dịch nghiêm ngặt về logic. Ưu điểm của chiến lược là khả năng thích ứng động và kiểm soát rủi ro, nhưng cũng cần chú ý đến hoạt động của thị trường ngang.
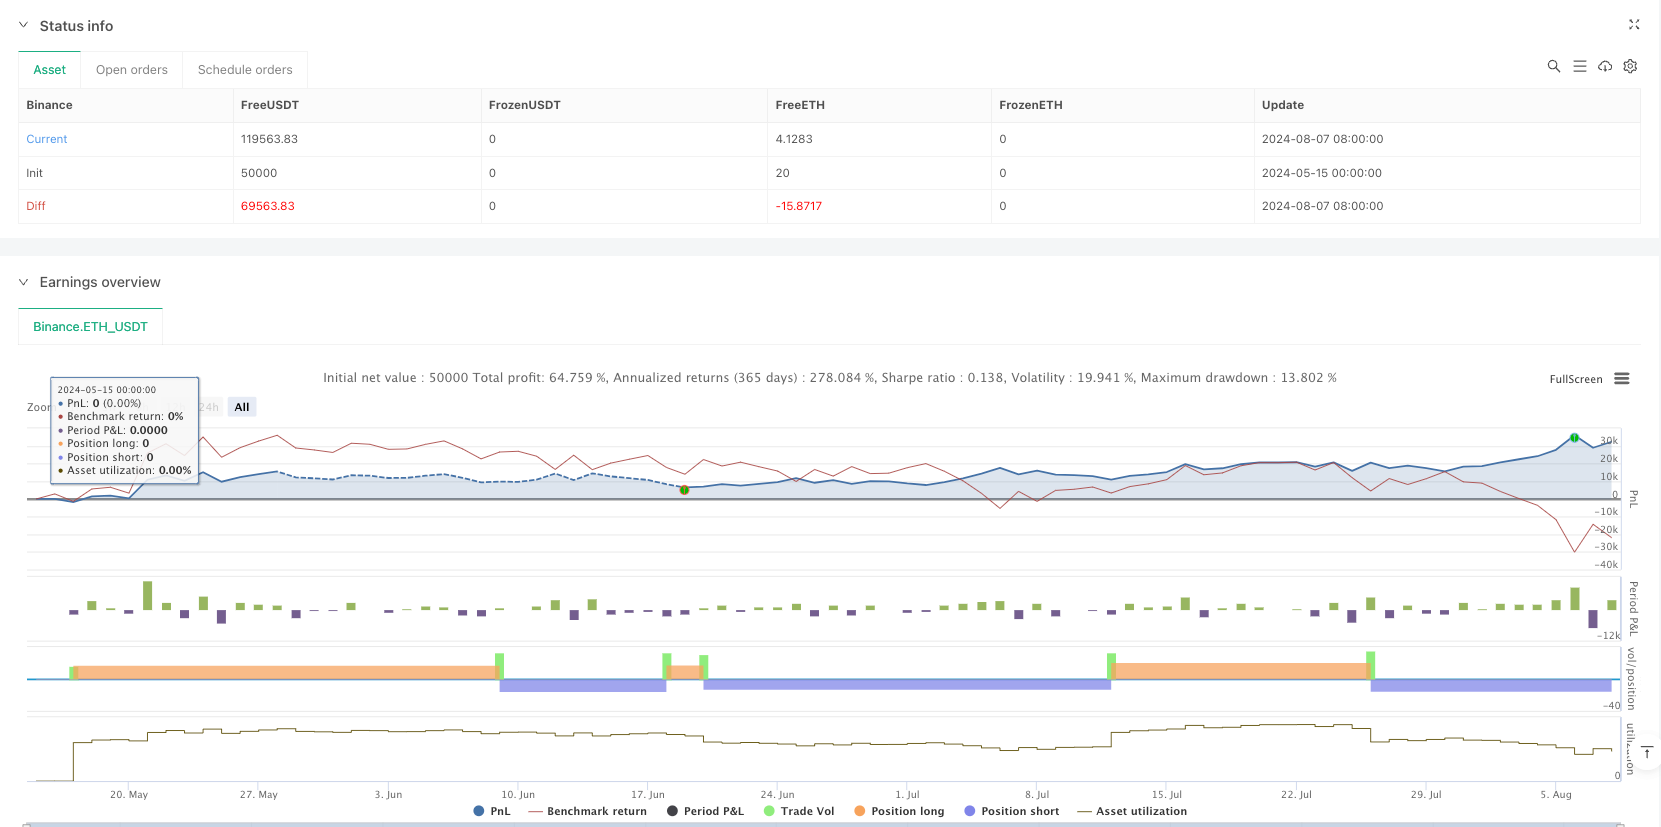
/*backtest
start: 2024-05-15 00:00:00
end: 2024-08-08 00:00:00
period: 1d
basePeriod: 1d
exchanges: [{"eid":"Binance","currency":"ETH_USDT"}]
*/

//@version=6
strategy(title="UT Bot Strategy", overlay=true, default_qty_type=strategy.percent_of_equity, default_qty_value=100)

// Inputs
a = input.float(1, title="Key Value. 'This changes the sensitivity'")
c = input.int(10, title="ATR Period")
h = input.bool(false, title="Signals from Heikin Ashi Candles")

// Calculate ATR
xATR = ta.atr(c)
nLoss = a * xATR

// Source for calculations
src = h ? request.security(syminfo.tickerid, timeframe.period, hlc3) : close

// ATR Trailing Stop logic
var float xATRTrailingStop = na
if (not na(xATRTrailingStop[1]) and src > xATRTrailingStop[1] and src[1] > xATRTrailingStop[1])
    xATRTrailingStop := math.max(xATRTrailingStop[1], src - nLoss)
else if (not na(xATRTrailingStop[1]) and src < xATRTrailingStop[1] and src[1] < xATRTrailingStop[1])
    xATRTrailingStop := math.min(xATRTrailingStop[1], src + nLoss)
else
    xATRTrailingStop := src > xATRTrailingStop[1] ? src - nLoss : src + nLoss

// Position logic
var int pos = 0
if (not na(xATRTrailingStop[1]) and src[1] < xATRTrailingStop[1] and src > xATRTrailingStop[1])
    pos := 1
else if (not na(xATRTrailingStop[1]) and src[1] > xATRTrailingStop[1] and src < xATRTrailingStop[1])
    pos := -1
else
    pos := pos[1]

xcolor = pos == -1 ? color.red : pos == 1 ? color.green : color.blue

// Entry and Exit Signals
ema = ta.ema(src, 1)
above = ta.crossover(ema, xATRTrailingStop)
below = ta.crossover(xATRTrailingStop, ema)

buy = src > xATRTrailingStop and above
sell = src < xATRTrailingStop and below

// Strategy Execution
if (buy)
    strategy.entry("UT Long", strategy.long)
if (sell)
    strategy.entry("UT Short", strategy.short)

// Plotting and Alerts
plotshape(buy, title="Buy", text='Buy', style=shape.labelup, location=location.belowbar, color=color.green, textcolor=color.white, size=size.tiny)
plotshape(sell, title="Sell", text='Sell', style=shape.labeldown, location=location.abovebar, color=color.red, textcolor=color.white, size=size.tiny)

barcolor(src > xATRTrailingStop ? color.green : src < xATRTrailingStop ? color.red : na)

alertcondition(buy, title="UT Long", message="UT Long")
alertcondition(sell, title="UT Short", message="UT Short")