
Tổng quan
Chiến lược này là một hệ thống theo dõi xu hướng kết hợp nhiều trung bình di chuyển, chỉ số động và kiểm soát rủi ro động. Chiến lược xác định cơ hội giao dịch bằng cách phân tích xu hướng giá cả, động lực thị trường và tỷ lệ biến động, đồng thời sử dụng quản lý vị trí nghiêm ngặt và cơ chế dừng để kiểm soát rủi ro.
Nguyên tắc chiến lược
Chiến lược này sử dụng nhiều lớp xác thực để xác nhận tín hiệu giao dịch:
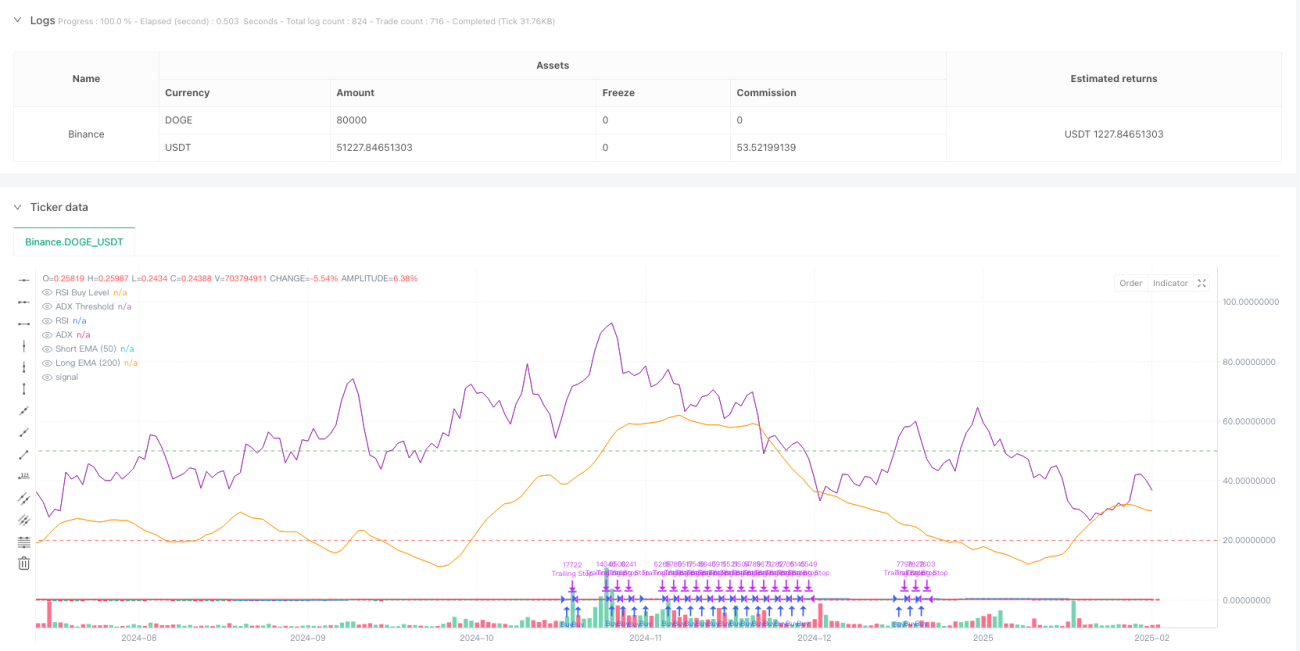
- Xác định xu hướng: Sử dụng hai chỉ số trung bình di chuyển 50 và 200 ngày để đánh giá xu hướng trung và dài hạn, yêu cầu đường trung bình ngắn hạn kéo dài trên đường trung bình dài hạn hơn 10 chu kỳ.
- Xác minh động lực: Sử dụng chỉ số RSI để xác minh động lực giá, xác nhận động lực tăng lên khi giá trị RSI lớn hơn mức giảm đặt ((đặc biệt là 50).
- Sức mạnh của xu hướng: giới thiệu chỉ số xu hướng trung bình ((ADX) để đo cường độ của xu hướng, ADX lớn hơn 20 cho thấy xu hướng là đáng kể.
- Kiểm soát rủi ro động: Kiểm soát động dựa trên thiết kế ATR, khoảng cách dừng 2.5 lần so với ATR, đồng thời thiết lập cơ chế theo dõi dừng.
- Quản lý vị trí thông minh: Số lượng vị trí mở dựa trên tỷ lệ quyền lợi và rủi ro dự kiến của tài khoản, kết hợp với tính toán động của ATR.
Lợi thế chiến lược
- Xác minh đa tín hiệu: Xác minh tín hiệu bằng cách xác minh các chỉ số đa chiều như đường trung bình, động lực và cường độ xu hướng.
- Quản lý rủi ro động: Sử dụng dừng động dựa trên biến động và theo dõi dừng, có thể điều chỉnh tùy theo tình trạng thị trường.
- Kiểm soát vị trí thông minh: Điều chỉnh vị trí động dựa trên quy mô tài khoản và biến động thị trường, kiểm soát hiệu quả rủi ro giao dịch đơn lẻ.
- Yêu cầu liên tục xu hướng: tránh phá vỡ giả mạo bằng cách đặt yêu cầu về thời gian liên tục xu hướng.
- Gợi ý giao dịch có hệ thống: tích hợp chức năng nhắc nhở tín hiệu giao dịch, dễ dàng hoạt động trong thời gian thực.
Rủi ro chiến lược
- Rủi ro đảo ngược xu hướng: Có thể có sự rút lui lớn khi kết thúc xu hướng mạnh, nên điều chỉnh kết hợp với mặt vĩ mô của thị trường.
- Hành động của thị trường rung động: Trong thị trường rung động ngang có thể tạo ra giao dịch thường xuyên, làm tăng chi phí giao dịch.
- Tính nhạy cảm của tham số: Cài đặt nhiều tham số chỉ số có thể ảnh hưởng đến hiệu suất của chiến lược và cần được tối ưu hóa thông qua phản hồi.
- Tác động của điểm trượt: Có thể có điểm trượt lớn hơn khi thị trường thiếu thanh khoản, ảnh hưởng đến lợi nhuận chiến lược.
Hướng tối ưu hóa chiến lược
- Khả năng thích ứng với môi trường thị trường: có thể giới thiệu các chỉ số biến động (như VIX) để điều chỉnh các tham số chiến lược một cách động, cải thiện khả năng thích ứng trong các môi trường thị trường khác nhau.
- Bộ lọc tín hiệu: Xem xét thêm xác thực chỉ số giao dịch để cải thiện chất lượng tín hiệu.
- Cơ chế dừng: Có thể thiết kế cơ chế dừng động dựa trên biến động của thị trường, tối ưu hóa tỷ lệ thu hồi lợi nhuận.
- Tối ưu hóa chu kỳ thời gian: Cân nhắc xác minh sự đồng nhất của tín hiệu trên các chu kỳ thời gian khác nhau để tăng sự ổn định giao dịch.
- Tối ưu hóa học máy: có thể giới thiệu các tham số tối ưu hóa động của thuật toán học máy, cải thiện khả năng thích ứng chiến lược.
Tóm tắt
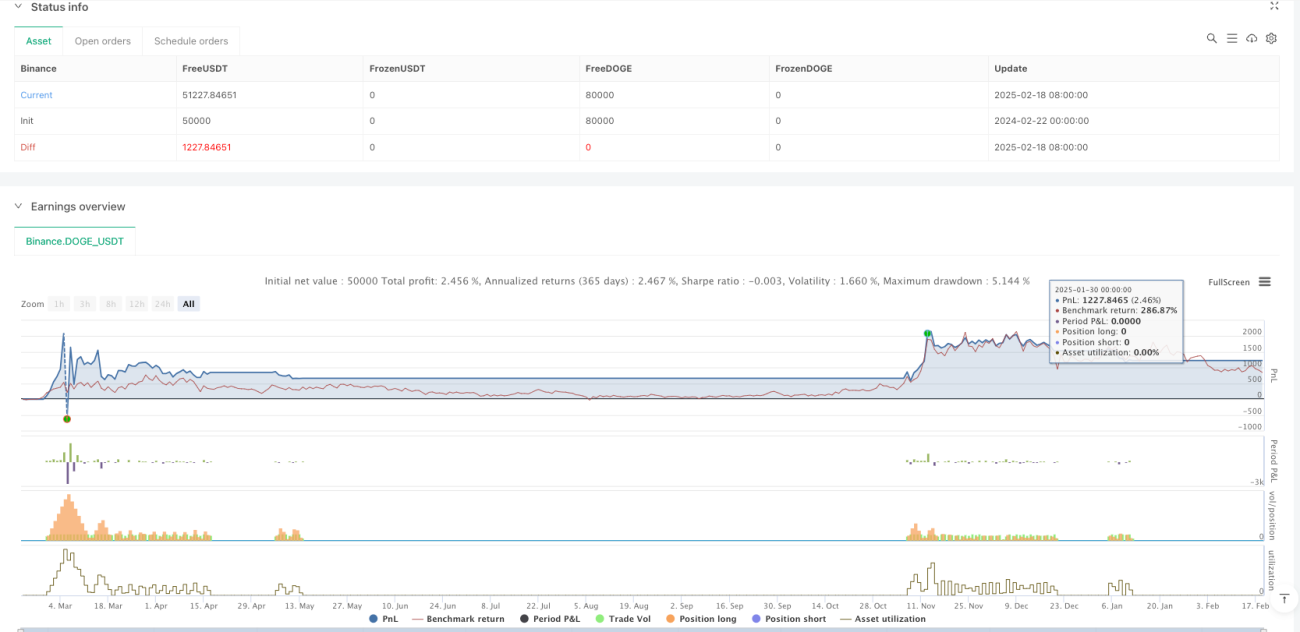
Chiến lược này xây dựng một hệ thống giao dịch theo dõi xu hướng hoàn chỉnh thông qua việc sử dụng tổng hợp nhiều chỉ số kỹ thuật. Chiến lược này hoạt động tốt trong việc kiểm soát rủi ro, kiểm soát hiệu quả việc rút lui thông qua dừng lỗ động và quản lý vị trí. Chiến lược có khả năng mở rộng mạnh mẽ, lưu trữ nhiều hướng tối ưu hóa.
Overview
This strategy is a trend following system that combines multiple moving averages, momentum indicators, and dynamic risk control. It identifies trading opportunities by analyzing price trends, market momentum, and volatility while implementing strict position management and stop-loss mechanisms. The core logic revolves around the crossover of long and short-term exponential moving averages (EMA) combined with the Relative Strength Index (RSI), using Average True Range (ATR) for dynamic stop-loss positioning.
Strategy Principles
The strategy employs a multi-layer verification mechanism to confirm trading signals:
- Trend Confirmation: Uses 50-day and 200-day EMAs to judge medium and long-term trends, requiring the short-term average to remain above the long-term average for more than 10 periods.
- Momentum Verification: Uses RSI to verify price momentum, confirming upward momentum when RSI exceeds the set threshold (default 50).
- Trend Strength: Incorporates Average Directional Index (ADX) to measure trend strength, with ADX above 20 indicating significant trend.
- Dynamic Risk Control: Designs dynamic stop-loss based on ATR, with stop-loss distance set at 2.5 times ATR, including trailing stop mechanism.
- Intelligent Position Management: Dynamically calculates position size based on account equity and preset risk ratio in combination with ATR.
Strategy Advantages
- Multiple Signal Verification: Improves signal reliability through validation across multiple dimensions including moving averages, momentum, and trend strength.
- Dynamic Risk Management: Employs volatility-based dynamic and trailing stops that adapt to market conditions.
- Intelligent Position Control: Dynamically adjusts positions based on account size and market volatility, effectively controlling single trade risk.
- Trend Persistence Requirement: Avoids false breakouts by setting trend duration requirements.
- Systematic Trading Alerts: Integrates trading signal notifications for real-time operation.
Strategy Risks
- Trend Reversal Risk: May experience significant drawdowns at trend endings, suggesting adjustment based on macro market conditions.
- Sideways Market Performance: May generate frequent trades in range-bound markets, increasing transaction costs.
- Parameter Sensitivity: Strategy performance affected by multiple indicator parameters, requiring backtest optimization.
- Slippage Impact: May face significant slippage in low liquidity conditions, affecting strategy returns.
Optimization Directions
- Market Environment Adaptation: Consider introducing volatility indicators (like VIX) for dynamic parameter adjustment to improve adaptability across different market conditions.
- Signal Filtering: Consider adding volume indicator verification to improve signal quality.
- Profit-Taking Mechanism: Design dynamic profit-taking mechanisms based on market volatility to optimize return-to-drawdown ratio.
- Timeframe Optimization: Consider validating signal consistency across different timeframes to improve trading stability.
- Machine Learning Optimization: Consider introducing machine learning algorithms for dynamic parameter optimization to enhance strategy adaptability.
Summary
This strategy constructs a complete trend following trading system through the comprehensive use of multiple technical indicators. It shows excellent performance in risk control through dynamic stop-loss and position management. The strategy demonstrates strong extensibility with multiple optimization directions reserved. Traders are advised to adjust parameters according to specific market characteristics and their own risk preferences when implementing in live trading.
- 1