Chiến lược giao cắt động lượng xu hướng động - Hệ thống giao dịch định lượng dựa trên các chỉ báo EMA kép và MACD

Tổng quan
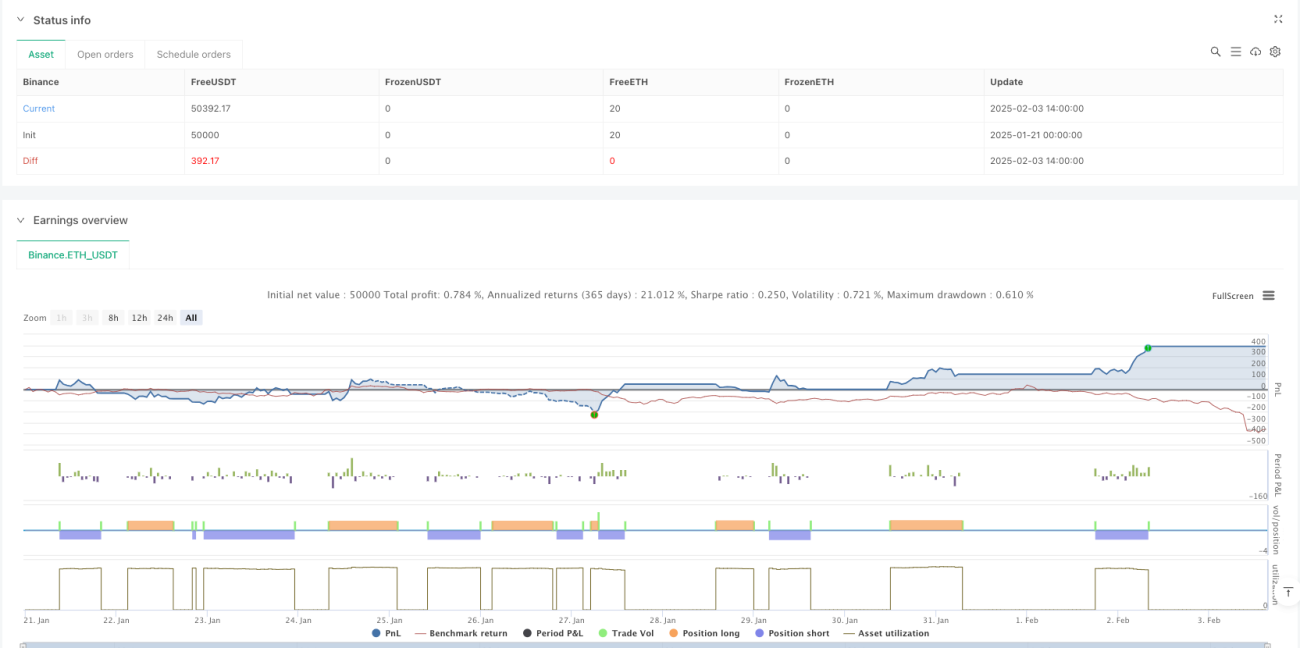
Chiến lược này là một hệ thống giao dịch định lượng kết hợp các chỉ số di chuyển trung bình (EMA) và xu hướng di chuyển trung bình (MACD). Bằng cách tích hợp các tín hiệu chéo của EMA ngắn hạn và dài hạn, và xác nhận động lực MACD, nó cung cấp cho các nhà giao dịch một giải pháp theo dõi xu hướng toàn diện. Chiến lược này cũng bao gồm các cơ chế dừng và dừng động, kiểm soát rủi ro một cách hiệu quả trong khi theo đuổi tối đa hóa lợi nhuận.
Nguyên tắc chiến lược
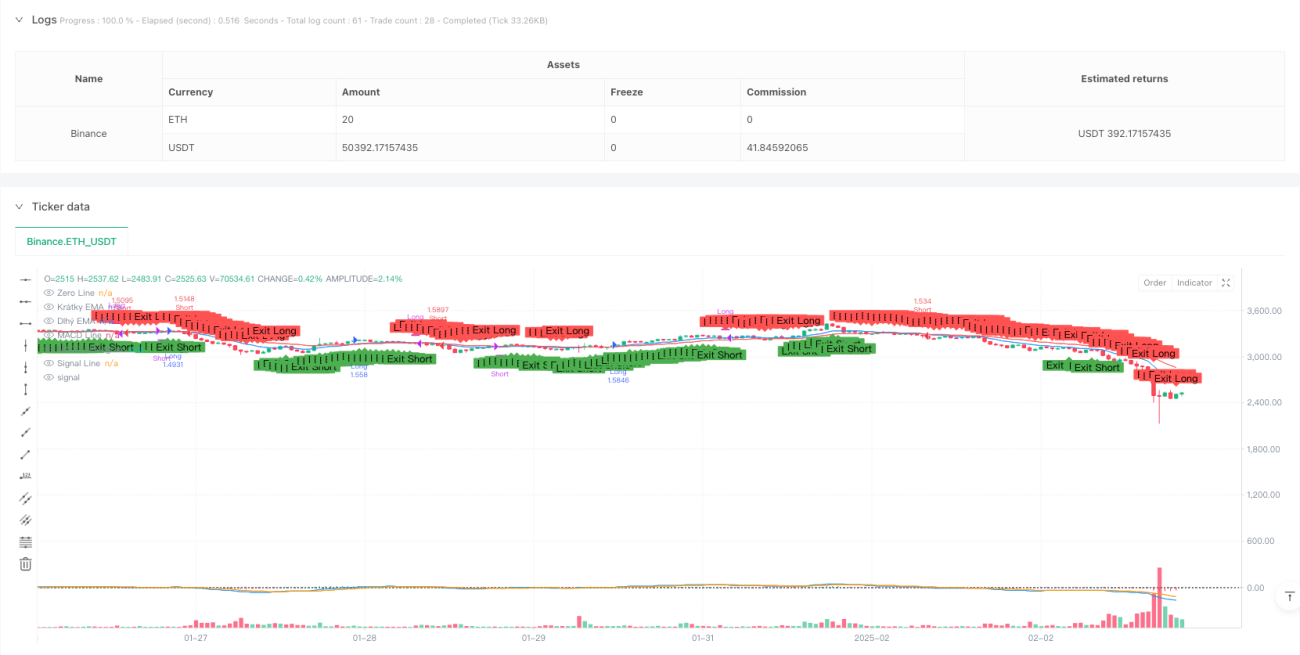
Lập luận cốt lõi của chiến lược dựa trên sự phối hợp của hai chỉ số kỹ thuật. Đầu tiên, sử dụng EMA 12 chu kỳ và 26 chu kỳ để xác định xu hướng thị trường, tạo ra tín hiệu làm nhiều khi vượt qua EMA dài hạn trên EMA ngắn hạn và tạo ra tín hiệu làm trống khi đi xuống. Tiếp theo, sử dụng chỉ số MACD (cài đặt 12 , 26 , 9) để xác nhận động lực xu hướng, yêu cầu mối quan hệ vị trí của đường MACD với đường tín hiệu hỗ trợ tín hiệu giao dịch do EMA tạo ra.
Lợi thế chiến lược
- Cơ chế xác nhận tín hiệu được cải tiến: xác nhận kép động cơ EMA và MACD, giảm đáng kể nguy cơ đột phá giả
- Quản lý rủi ro linh hoạt: Có phần trăm Stop Loss Stop để dễ dàng điều chỉnh theo các điều kiện thị trường khác nhau và các loại giao dịch
- Hiển thị hiệu quả tuyệt vời: hiển thị rõ ràng các đường EMA, chỉ số MACD và dấu hiệu tín hiệu giao dịch trên biểu đồ
- Khả năng điều chỉnh: cho phép điều chỉnh chu kỳ EMA, tham số MACD và tỷ lệ kiểm soát rủi ro để phù hợp với các chiến lược giao dịch khác nhau
Rủi ro chiến lược
- Rủi ro đảo ngược xu hướng: có thể xảy ra giao thoa thường xuyên trong thị trường biến động, dẫn đến tín hiệu sai
- Vấn đề về sự chậm trễ: EMA và MACD đều là các chỉ số chậm trễ, có thể bỏ lỡ điểm vào tốt nhất khi đi nhanh
- Rủi ro quản lý vốn: Lãi suất dừng cố định có thể không linh hoạt trong môi trường biến động cao
- Rủi ro tối ưu hóa tham số: tối ưu hóa quá mức có thể dẫn đến chiến lược không đạt được kết quả phản hồi trong thực tế
Hướng tối ưu hóa chiến lược
- Tiếp theo là giới thiệu các chỉ số biến động: khuyến nghị thêm các chỉ số ATR để điều chỉnh động mức dừng và dừng
- Thêm bộ lọc môi trường thị trường: có thể đánh giá cường độ của xu hướng bằng các chỉ số như ADX, tránh giao dịch trong thị trường bất ổn
- Tối ưu hóa cơ chế xác nhận tín hiệu: Xem xét thêm xác nhận số lượng giao hàng hoặc các chỉ số động lực khác để hỗ trợ
- Hoàn thiện quản lý tài chính: Thực hiện hệ thống quản lý vị thế động dựa trên quyền lợi tài khoản
Tóm tắt
Đây là một chiến lược theo dõi xu hướng được thiết kế hợp lý, logic rõ ràng. Bằng cách kết hợp các lợi thế của EMA và MACD, trong khi duy trì chiến lược đơn giản và dễ hiểu, tạo ra tín hiệu giao dịch đáng tin cậy hơn.
- 1