Chiến lược đảo ngược xu hướng động lượng kép dựa trên RSI và RSI ngẫu nhiên

Tổng quan
Đây là một chiến lược giao dịch đảo ngược xu hướng kết hợp các chỉ số tương đối mạnh (RSI) và các chỉ số tương đối mạnh (RSI Stochastic). Chiến lược này là để nắm bắt các điểm đảo ngược tiềm năng bằng cách xác định tình trạng quá mua quá bán của thị trường và sự thay đổi động lực.
Nguyên tắc chiến lược
Lập luận chính của chiến lược bao gồm các bước quan trọng sau:
- Đầu tiên, tính RSI của giá đóng cửa để đánh giá tình trạng quá mua quá bán
- Tính toán dựa trên giá trị RSI % K và % D của Stochastic RSI
- Khi RSI nằm trong vùng oversold (chỉ mặc định dưới 30) và đường %K của Stochastic RSI đi từ dưới lên qua đường %D, kích hoạt nhiều tín hiệu
- Kích hoạt tín hiệu giảm giá khi RSI nằm trong khu vực quá mua (bên dưới 70 theo mặc định) và đường %K của Stochastic RSI đi từ trên xuống qua đường %D
- Khi có điều kiện RSI ngược hoặc Stochastic RSI crossover, vị trí bằng phẳng sẽ bị rút ra
Lợi thế chiến lược
- Cơ chế xác nhận kép - Sử dụng kết hợp giữa RSI và Stochastic RSI, có thể làm giảm hiệu quả rủi ro của phá vỡ giả
- Các tham số có thể tùy chỉnh - Các tham số quan trọng của chiến lược như chu kỳ RSI, giá trị thềm mua bán quá mức và giá trị thềm bán quá mức có thể được điều chỉnh theo các điều kiện thị trường khác nhau
- Hình ảnh động - Chiến lược cung cấp hiển thị biểu đồ trực tiếp của RSI và Stochastic RSI để giúp người giao dịch theo dõi
- Quản lý rủi ro tích hợp - bao gồm các cơ chế dừng lỗ và đóng lợi nhuận hoàn chỉnh
- Khả năng thích ứng - có thể áp dụng cho các chu kỳ thời gian và môi trường thị trường khác nhau
Rủi ro chiến lược
- Rủi ro của thị trường chấn động - có thể tạo ra các tín hiệu sai thường xuyên trong thị trường chấn động ngang
- Rủi ro bị tụt hậu - tín hiệu có thể bị tụt hậu do sử dụng nhiều đường trung bình
- Tính nhạy cảm của tham số - các thiết lập tham số khác nhau có thể dẫn đến kết quả giao dịch khác nhau đáng kể
- Tùy thuộc vào môi trường thị trường - có thể bỏ lỡ một số hoạt động trong thị trường có xu hướng mạnh
- Quản lý rủi ro - Cần thiết lập tỷ lệ nắm giữ hợp lý để kiểm soát rủi ro
Hướng tối ưu hóa chiến lược
- Thêm bộ lọc xu hướng - có thể thêm đường trung bình di chuyển dài hạn làm bộ lọc xu hướng, chỉ mở vị trí theo hướng xu hướng
- Cơ chế dừng tối ưu hóa - có thể giới thiệu dừng động, chẳng hạn như dừng theo dõi hoặc dừng ATR
- Giới thiệu chỉ số giao thông - Kết hợp phân tích giao thông có thể cải thiện độ tin cậy của tín hiệu
- Thêm bộ lọc thời gian - tránh các thời điểm tin tức quan trọng hoặc thời gian lưu động thấp
- Phát triển tham số thích ứng - Tự động điều chỉnh tham số chiến lược theo biến động thị trường
Tóm tắt
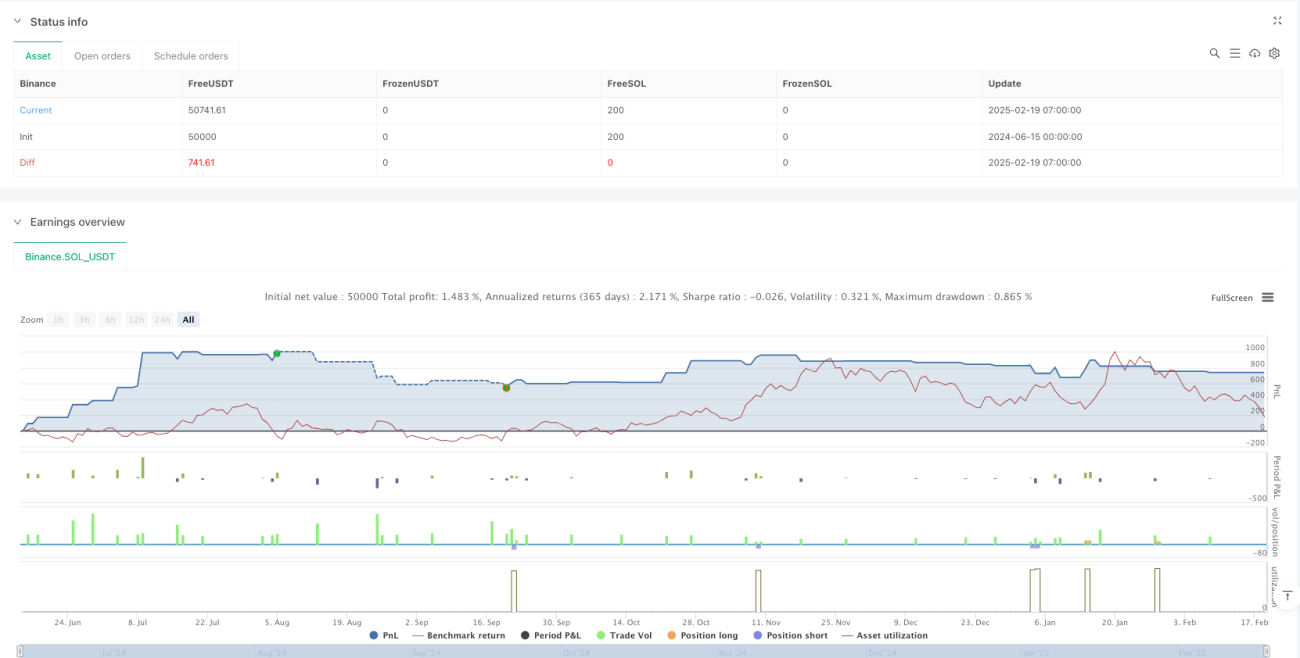
Đây là một chiến lược tổng hợp kết hợp động lực và xu hướng đảo ngược để xác định cơ hội giao dịch tiềm năng thông qua sự phối hợp của RSI và Stochastic RSI. Chiến lược được thiết kế hợp lý, có khả năng điều chỉnh và thích ứng tốt. Tuy nhiên, trong ứng dụng thực tế cần chú ý đến lựa chọn và kiểm soát rủi ro của môi trường thị trường, khuyến nghị kiểm tra lại đầy đủ và tối ưu hóa tham số trước khi giao dịch thực tế.
/*backtest
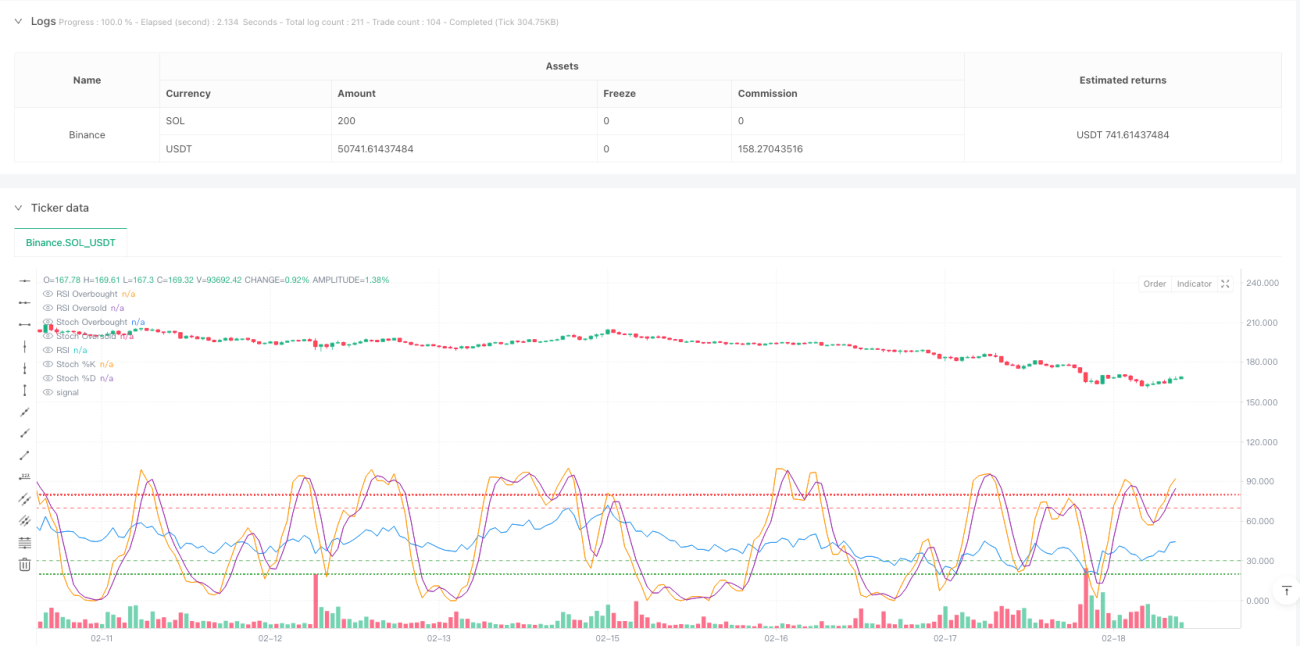
start: 2024-06-15 00:00:00
end: 2025-02-19 08:00:00
period: 1h
basePeriod: 1h
exchanges: [{"eid":"Binance","currency":"SOL_USDT"}]
*/
//@version=5
strategy("RSI + Stochastic RSI Strategy", overlay=true, initial_capital=100000, default_qty_type=strategy.percent_of_equity, default_qty_value=10)
// INPUTS- 1