Chiến lược đột phá xu hướng tích hợp chỉ báo kỹ thuật đa chiều

Tổng quan
Chiến lược này là một hệ thống giao dịch phá vỡ xu hướng kết hợp nhiều chỉ số kỹ thuật và mô hình đồ họa. Nó nắm bắt các điểm thay đổi xu hướng thị trường bằng cách xác định các hình dạng đồ họa quan trọng (như hai đỉnh / hai đáy, đầu vai / đáy) và giá phá vỡ, đồng thời kết hợp các chỉ số kỹ thuật như EMA, ATR và khối lượng giao dịch để lọc tín hiệu và quản lý rủi ro, để theo dõi xu hướng hiệu quả và kiểm soát rủi ro.
Nguyên tắc chiến lược
Logic cốt lõi của chiến lược bao gồm ba phần chính:
- Nhận dạng mô hình đồ họa: Sử dụng phương pháp cửa sổ trượt để nhận dạng hình dạng kỹ thuật cổ điển như hình dạng hai đỉnh / hai đáy, hình đầu vai, và tín hiệu đảo ngược xu hướng bằng cách so sánh điểm cao thấp và xác nhận chéo EMA.
- Hệ thống xác nhận xu hướng: Sử dụng 50 chu kỳ EMA làm bộ lọc xu hướng, kết hợp với giá phá vỡ xác nhận hướng xu hướng, xác nhận hiệu quả tín hiệu thông qua bộ lọc khối lượng giao dịch ((yêu cầu khối lượng giao dịch cao hơn 120% của 20 ngày).
- Hệ thống quản lý rủi ro: dựa trên 14 chu kỳ ATR thiết lập động dừng lỗ, kiểm soát chính xác tỷ lệ lợi nhuận rủi ro bằng cách nhân ATR 1,5 lần.
Lợi thế chiến lược
- Tích hợp tín hiệu đa chiều: kết hợp mô hình đồ họa, đường trung bình di chuyển, thông tin thị trường về tỷ lệ dao động và khối lượng giao dịch nhiều chiều, tăng độ tin cậy tín hiệu.
- Quản lý rủi ro động: sử dụng ATR để điều chỉnh động vị trí dừng lỗ để phù hợp với môi trường thị trường khác nhau.
- Mức độ tự động hóa cao: Hệ thống tự động nhận dạng hình thức, phát tín hiệu giao dịch và thực hiện lệnh, giảm sự can thiệp của con người.
- Hướng dẫn trực quan rõ ràng: hiển thị trực quan các tín hiệu giao dịch thông qua hệ thống đánh dấu đồ họa và cảnh báo.
Rủi ro chiến lược
- Rủi ro phá vỡ giả: Các tín hiệu phá vỡ giả có thể xuất hiện trong thị trường bất ổn và cần được xác nhận thông qua khối lượng giao dịch nghiêm ngặt.
- Rủi ro bị tụt hậu: Các chỉ số như đường trung bình di chuyển và ATR có thể bị tụt hậu, có thể bỏ lỡ thời điểm xuất phát tốt nhất.
- Tính nhạy cảm của tham số: hiệu quả của chiến lược bị ảnh hưởng nhiều bởi thiết lập tham số, cần xác định tham số tối ưu bằng cách tối ưu hóa phản hồi.
- Tùy thuộc vào môi trường thị trường: Trong thị trường ngang không có xu hướng rõ ràng, chiến lược có thể không hoạt động tốt.
Hướng tối ưu hóa chiến lược
- Tiếp theo, các nhà đầu tư có thể sử dụng các chỉ số khác nhau để phân biệt các thị trường có xu hướng và thị trường chấn động. Các tham số chiến lược điều chỉnh động lực.
- Tích hợp lọc tín hiệu: Có thể xem xét thêm các chỉ số dao động như RSI để lọc thêm các tín hiệu phá vỡ giả.
- Kiểm soát rủi ro tốt hơn: giới thiệu hệ thống quản lý vị trí, điều chỉnh quy mô nắm giữ theo động thái biến động của thị trường.
- Tăng khả năng thích ứng: Phát triển hệ thống tham số thích ứng, tự động tối ưu hóa tham số chiến lược theo tình trạng thị trường.
Tóm tắt
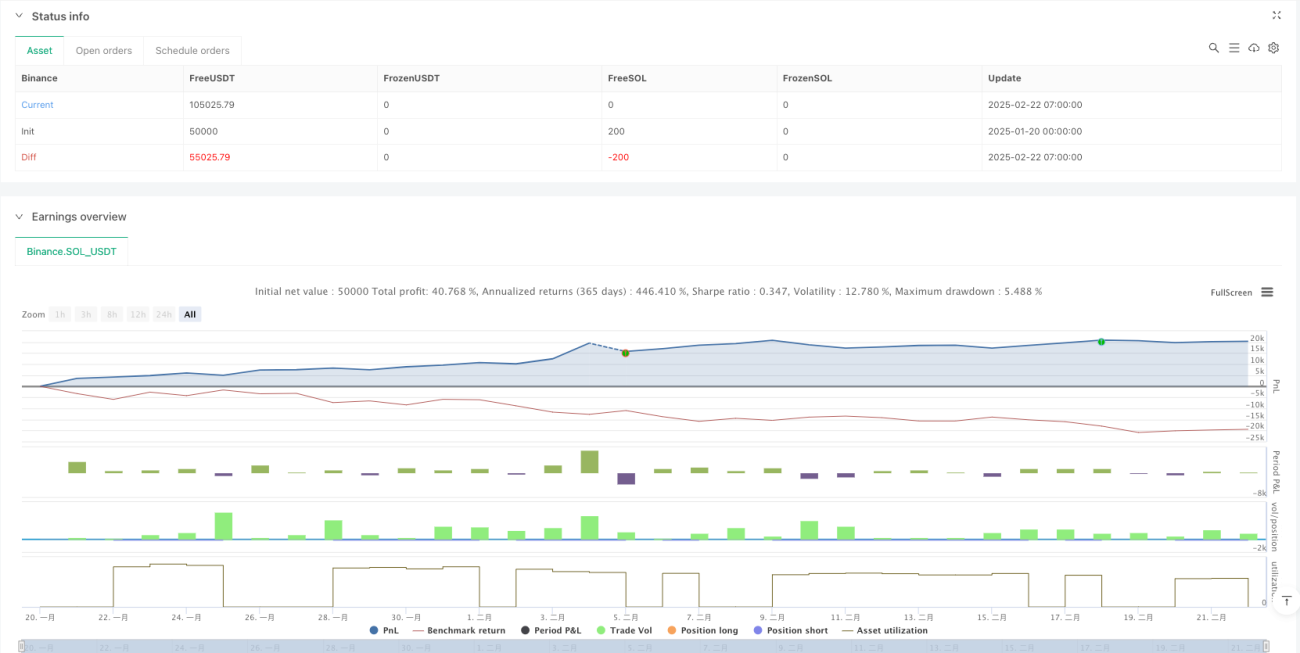
Chiến lược này thông qua việc áp dụng kết hợp các chỉ số kỹ thuật đa chiều, có thể nắm bắt hiệu quả các điểm biến động xu hướng thị trường. Thiết kế hệ thống đã cân nhắc đầy đủ các yếu tố quan trọng như tạo tín hiệu, xác nhận xu hướng và kiểm soát rủi ro, có tính thực tế mạnh mẽ.
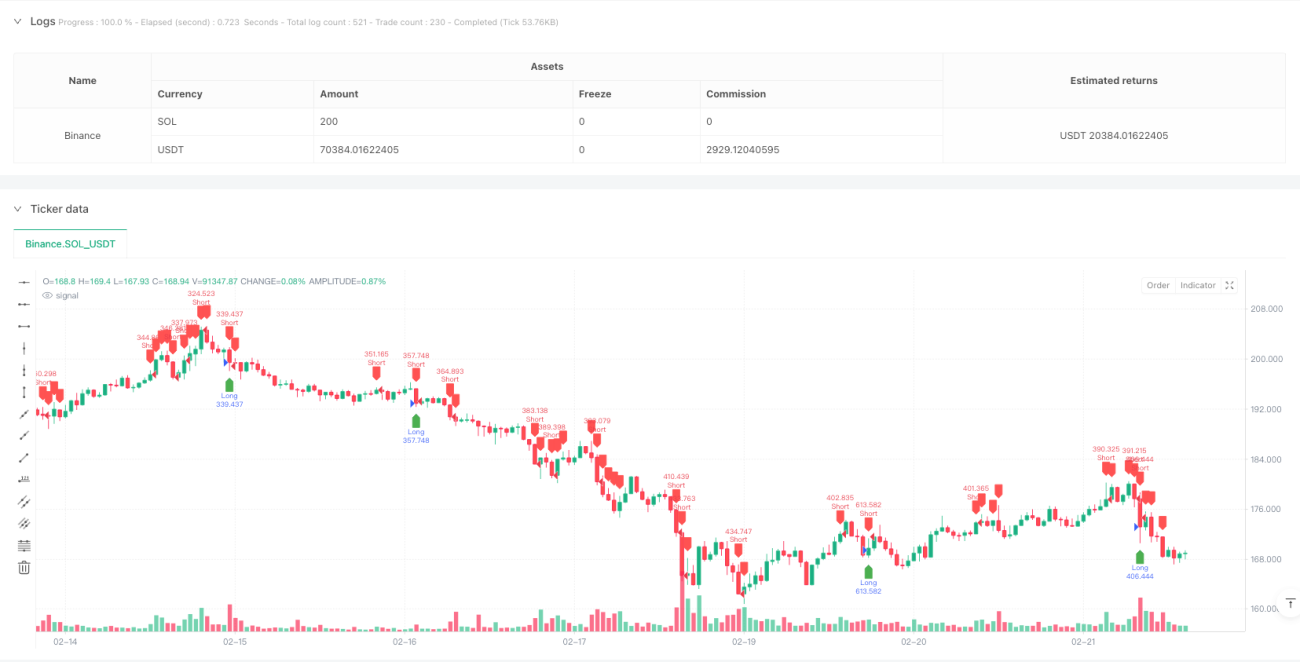
/*backtest
start: 2025-01-20 00:00:00
end: 2025-02-22 08:00:00
period: 1h
basePeriod: 1h
exchanges: [{"eid":"Binance","currency":"SOL_USDT"}]
*/

//@version=5
strategy("Ultimate Pattern Finder", overlay=true, default_qty_type=strategy.percent_of_equity, default_qty_value=100)

// 🎯 CONFIGURABLE PARAMETERS- 1