
Tổng quan
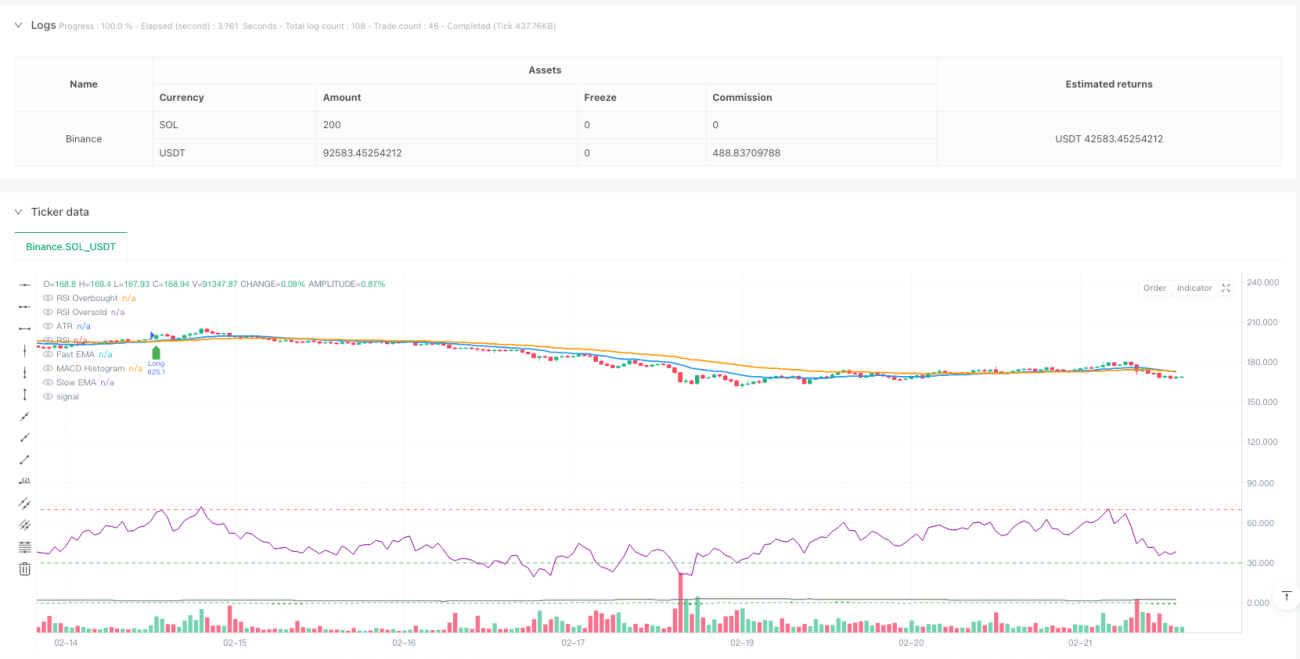
Chiến lược này là một hệ thống giao dịch theo dõi xu hướng toàn diện, kết hợp nhiều chỉ số kỹ thuật để xác định xu hướng và động lực của thị trường, đồng thời tích hợp cơ chế quản lý rủi ro động. Chiến lược xác nhận tín hiệu giao dịch bằng cách kết hợp hợp đồng nhất giữa đường trung bình, chỉ số tương đối mạnh (RSI) và phân tán xu hướng trung bình di chuyển (MACD) và sử dụng chỉ số sóng thực (ATR) để điều chỉnh động vị trí dừng lỗ, để thực hiện quản lý thích ứng rủi ro.
Nguyên tắc chiến lược
Lập luận cốt lõi của chiến lược được xây dựng trên cơ sở xác minh chéo của nhiều chỉ số kỹ thuật. Đầu tiên, xác định điểm biến động xu hướng tiềm năng bằng cách chéo đường trung bình di chuyển của chỉ số nhanh (EMA20) và đường trung bình di chuyển của chỉ số chậm (EMA50). Thứ hai, sử dụng chỉ số RSI để xác nhận liệu giá có nằm trong khu vực quá mua hoặc quá bán, do đó tránh giao dịch trong vùng cực.
Lợi thế chiến lược
- Cơ chế xác nhận tín hiệu đa chiều làm giảm đáng kể nguy cơ đột phá giả và tăng độ tin cậy của tín hiệu giao dịch.
- Hệ thống quản lý rủi ro động có thể tự động điều chỉnh vị trí dừng lỗ theo biến động của thị trường, tránh các vấn đề có thể gây ra bởi dừng cố định.
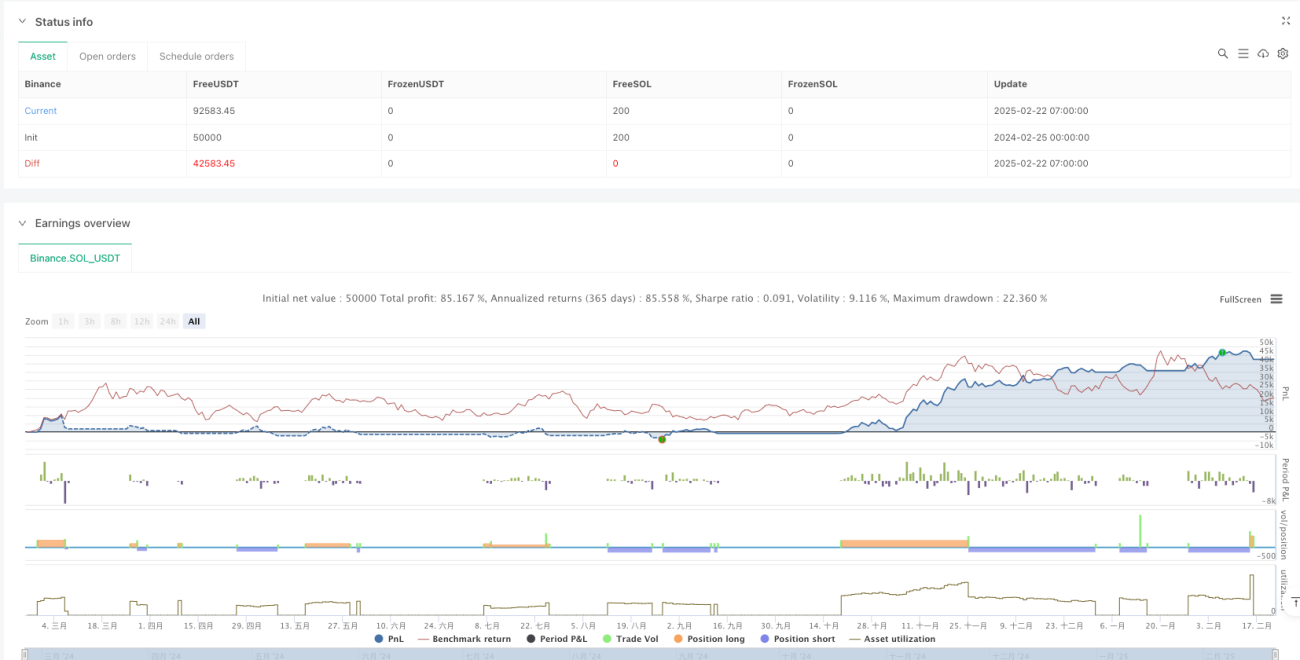
- Hệ thống quản lý tiền tự động tính toán quy mô giao dịch dựa trên quyền lợi tài khoản, đảm bảo tính nhất quán của lỗ hổng rủi ro.
- Chiến lược có khả năng thích ứng tốt, có thể được áp dụng cho các chu kỳ thời gian và môi trường thị trường khác nhau.
- Thiết kế bộ lọc lượng giao dịch có thể xác định các trường hợp mạnh mẽ có đặc điểm tham gia của cơ quan.
Rủi ro chiến lược
- Trong môi trường thị trường biến động mạnh, sự chậm trễ của nhiều chỉ số có thể gây ra sự chậm trễ tín hiệu nhập cảnh.
- Việc lọc quá nhiều chỉ số có thể làm mất đi một số cơ hội tiềm năng và làm giảm tỷ lệ chiến lược của bạn.
- Trong thị trường bất ổn, giao điểm có thể tạo ra các tín hiệu sai thường xuyên, làm tăng chi phí giao dịch.
- ATR dừng có thể dẫn đến rút lui lớn hơn khi biến động đột ngột mở rộng.
- Dựa vào chỉ số giao dịch có thể tạo ra tín hiệu sai lệch trong thị trường ít lưu động.
Hướng tối ưu hóa chiến lược
- Có thể giới thiệu cơ chế tham số thích ứng, điều chỉnh tham số chỉ số theo các động thái khác nhau của môi trường thị trường.
- Tăng bộ lọc cường độ xu hướng và giảm tần suất giao dịch trong môi trường xu hướng yếu.
- Tối ưu hóa cơ chế dừng lỗ, có thể kết hợp các vị trí hỗ trợ và kháng cự để thiết lập điểm dừng lỗ thông minh hơn.
- Tham gia mô hình dự đoán biến động, điều chỉnh các tham số quản lý rủi ro trước.
- Phát triển mô hình phân tích khối lượng giao dịch phức tạp hơn để cải thiện độ chính xác của phán đoán về sự tham gia thị trường.
Tóm tắt
Đây là một chiến lược theo dõi xu hướng được thiết kế hoàn hảo để tăng độ tin cậy của tín hiệu giao dịch thông qua sự phối hợp của nhiều chỉ số kỹ thuật và được trang bị hệ thống quản lý rủi ro chuyên nghiệp. Chiến lược có khả năng mở rộng mạnh mẽ, có thể được sử dụng cho giao dịch trong ngày và phù hợp với việc nắm bắt xu hướng lâu dài hơn.
- 1