Hệ thống giao dịch giao thoa động lượng xu hướng trung bình động nhiều lần

Tổng quan
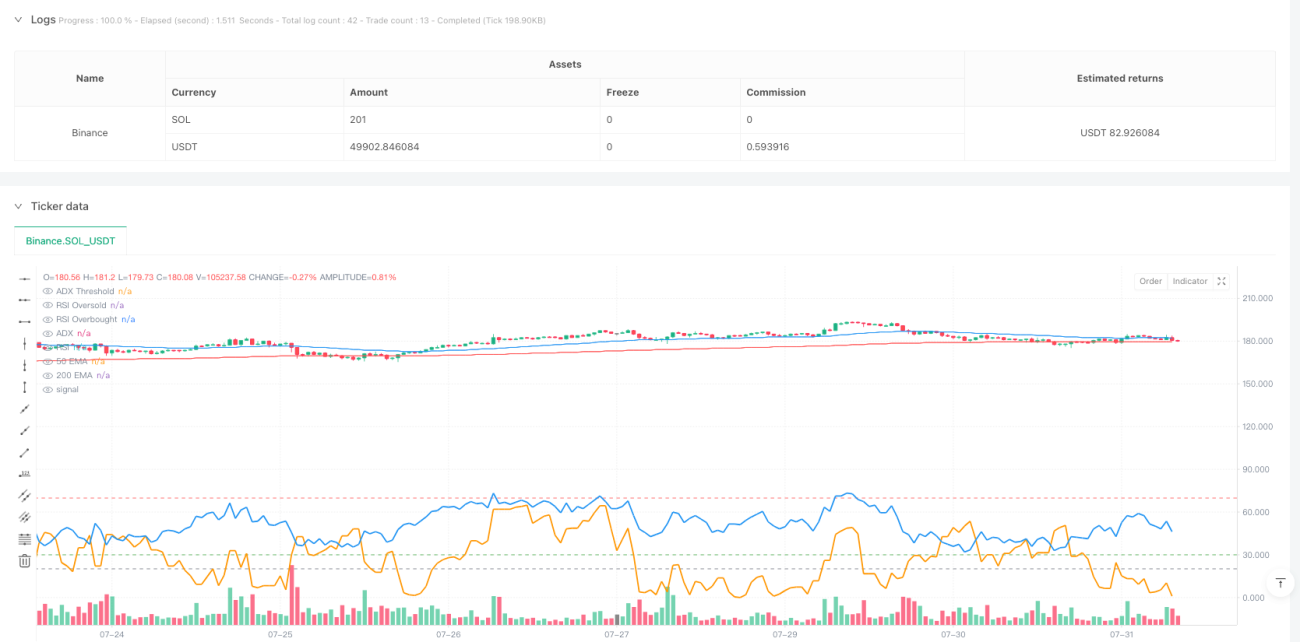
Chiến lược này là một hệ thống theo dõi xu hướng dựa trên nhiều chỉ số kỹ thuật, kết hợp các lợi thế của đường trung bình di chuyển ((EMA), đường trung bình xu hướng ((ADX) và đường trung bình di chuyển tương đối mạnh ((RSI)). Xác định xu hướng thị trường bằng cách giao chéo đường trung bình di chuyển của chỉ số 50 và 200 ngày, đồng thời sử dụng xu hướng yếu của bộ lọc ADX và sử dụng RSI để giao dịch trong khu vực tránh mua quá nhiều hoặc bán quá nhiều.
Nguyên tắc chiến lược
Logic cốt lõi của chiến lược này dựa trên các yếu tố chính sau:
- Xác định xu hướng: Sử dụng giao điểm giữa EMA (50 ngày) và EMA (200 ngày) để xác định xu hướng của thị trường. Khi EMA 50 ngày vượt qua EMA 200 ngày, điều này cho thấy xu hướng tăng; khi EMA 50 ngày vượt qua EMA 200 ngày, điều này cho thấy xu hướng giảm.
- Xác định cường độ xu hướng: Sử dụng chỉ số ADX để đo cường độ xu hướng, chỉ xem xét nhập cảnh khi ADX lớn hơn 20, đảm bảo chỉ giao dịch trong xu hướng mạnh.
- Bộ lọc động lực: Sử dụng bộ lọc động lực thông qua chỉ số RSI, chỉ mở vị trí khi RSI nằm trong khoảng 30-70, tránh giao dịch khu vực mua quá nhiều hoặc bán quá nhiều.
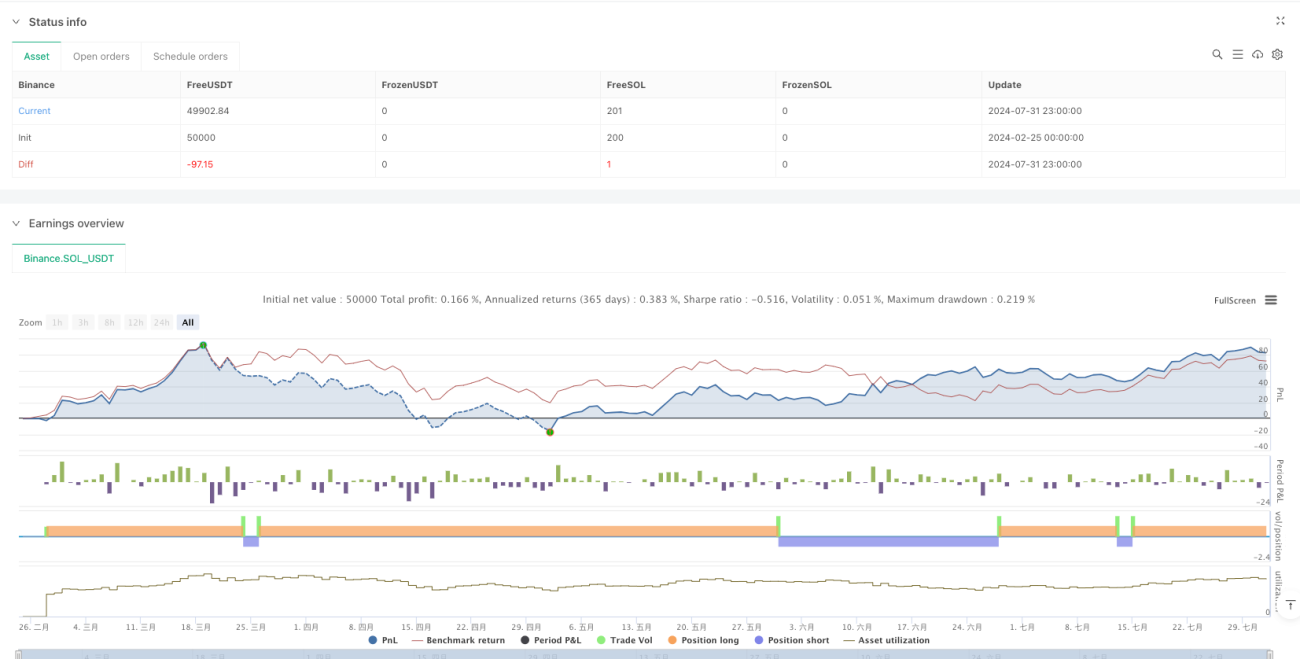
- Quản lý rủi ro: Sử dụng mục tiêu dừng lỗ và lợi nhuận động dựa trên ATR, đặt mục tiêu dừng lỗ lên 2 lần ATR và mục tiêu lợi nhuận lên 4 lần ATR.
Lợi thế chiến lược
- Xác nhận xu hướng đa chiều: Tăng đáng kể độ tin cậy của tín hiệu giao dịch bằng cách kết hợp chéo ngang, ADX và RSI lọc ba.
- Quản lý rủi ro động: Thiết lập dừng lỗ và lợi nhuận động dựa trên ATR, có thể điều chỉnh theo biến động của thị trường.
- Bộ lọc xu hướng yếu: Việc giới thiệu chỉ số ADX đã giúp tránh được giao dịch thường xuyên trong thị trường ngang.
- Chống việc theo đuổi cao và hạ thấp: RSI có thể được lọc để tránh giao dịch ở các vùng cực.
Rủi ro chiến lược
- Rủi ro đảo ngược xu hướng: Trong trường hợp đảo ngược nhanh chóng, sự chậm trễ của hệ thống đường trung bình có thể dẫn đến sự rút lui lớn.
- Rủi ro thị trường chấn động: Có thể có các tín hiệu phá vỡ sai lệch thường xuyên khi thị trường ở trong khu vực chấn động.
- Tính nhạy cảm của tham số: Cài đặt tham số của nhiều chỉ số cần được tối ưu hóa trong các môi trường thị trường khác nhau.
- Rủi ro trượt: Trong thị trường ít lưu động, giá giao dịch thực tế có thể có sai lệch lớn so với giá tín hiệu.
Hướng tối ưu hóa chiến lược
- Tiêu chuẩn giao dịch: Có thể xem xét thêm cơ chế xác nhận giao dịch, giao dịch chỉ khi đạt được mức vượt trội.
- Tối ưu hóa cơ chế dừng lỗ: Có thể xem xét sử dụng dừng theo dõi để bảo vệ lợi nhuận trong quá trình phát triển xu hướng.
- Thêm bộ lọc thời gian: Bạn có thể thêm bộ lọc thời gian giao dịch để tránh giao dịch trong thời gian có nhiều biến động.
- Phân loại môi trường thị trường: tùy thuộc vào môi trường thị trường khác nhau (( xu hướng, biến động) thay đổi động thái các tham số chiến lược.
Tóm tắt
Chiến lược này xây dựng một hệ thống giao dịch theo dõi xu hướng hoàn chỉnh bằng cách sử dụng nhiều chỉ số kỹ thuật tổng hợp. Ưu điểm của chiến lược là cơ chế xác nhận tín hiệu đa chiều và hệ thống quản lý rủi ro năng động, nhưng đồng thời cũng cần chú ý đến rủi ro của thị trường biến động và biến động. Bằng cách tối ưu hóa và hoàn thiện liên tục, chiến lược này có thể duy trì hiệu suất ổn định trong các môi trường thị trường khác nhau.
Overview
This strategy is a trend-following system based on multiple technical indicators, combining the advantages of Exponential Moving Averages (EMA), Average Directional Index (ADX), and Relative Strength Index (RSI). It identifies market trends through the crossover of 50-day and 200-day EMAs, filters weak trends using ADX, and avoids trading in overbought or oversold areas using RSI. The strategy employs dynamic stop-loss and take-profit targets based on Average True Range (ATR), ensuring both risk control and profit maximization.
Strategy Principles
The core logic of the strategy is built on the following key elements:
- Trend Identification: Uses the crossover of fast EMA (50-day) and slow EMA (200-day) to determine market trend direction. A bullish trend is signaled when the 50-day EMA crosses above the 200-day EMA, and a bearish trend when it crosses below.
- Trend Strength Confirmation: Utilizes the ADX indicator to measure trend strength, only considering entry when ADX is above 20, ensuring trades only in strong trends.
- Momentum Filtering: Applies RSI indicator for momentum filtering, only entering positions when RSI is between 30-70, avoiding trades in overbought or oversold areas.
- Risk Management: Uses ATR-based dynamic stop-loss and take-profit levels, with stop-loss set at 2x ATR and take-profit at 4x ATR.
Strategy Advantages
- Multi-dimensional Trend Confirmation: Combines EMA crossover, ADX, and RSI triple filtering to significantly improve signal reliability.
- Dynamic Risk Management: ATR-based dynamic stop-loss and take-profit settings adapt to market volatility.
- Weak Trend Filtering: Introduction of ADX effectively avoids frequent trading in ranging markets.
- Prevention of Extreme Entries: RSI filtering mechanism prevents trading in extreme areas.
Strategy Risks
- Trend Reversal Risk: The lag in moving average systems may lead to significant drawdowns in quick reversal scenarios.
- Range-bound Market Risk: May generate frequent false breakout signals during sideways markets.
- Parameter Sensitivity: Multiple indicator parameters need optimization across different market conditions.
- Slippage Risk: Actual execution prices may significantly deviate from signal prices in less liquid markets.
Strategy Optimization Directions
- Volume Indicator Integration: Consider adding volume confirmation, only trading on volume breakouts.
- Stop-loss Mechanism Enhancement: Consider implementing trailing stops to protect profits during trend development.
- Time Filter Addition: Add trading time filters to avoid high-volatility periods.
- Market Environment Classification: Dynamically adjust strategy parameters based on different market conditions (trending, ranging).
Summary
The strategy constructs a comprehensive trend-following trading system through the integrated use of multiple technical indicators. Its strengths lie in multi-dimensional signal confirmation and dynamic risk management systems, while attention must be paid to risks from trend reversals and ranging markets. Through continuous optimization and refinement, the strategy has the potential to maintain stable performance across different market environments.
- 1