Chiến lược giao thoa RSI và PSAR động kết hợp với hệ thống quản lý rủi ro

Tổng quan
Đây là một chiến lược giao dịch kết hợp chỉ số RSI và chỉ số chuyển hướng đường phân cực (PSAR) để nắm bắt xu hướng thị trường bằng cách thiết lập một khoảng bán tháo bán tháo động, kết hợp với tín hiệu chéo của giá và PSAR. Đồng thời, chiến lược này tích hợp hệ thống quản lý rủi ro hoàn chỉnh, bao gồm cơ chế dừng lỗ và quản lý vị trí, để thực hiện giao dịch mạnh mẽ hơn.
Nguyên tắc chiến lược
Chiến lược này dựa trên những logic cốt lõi sau:
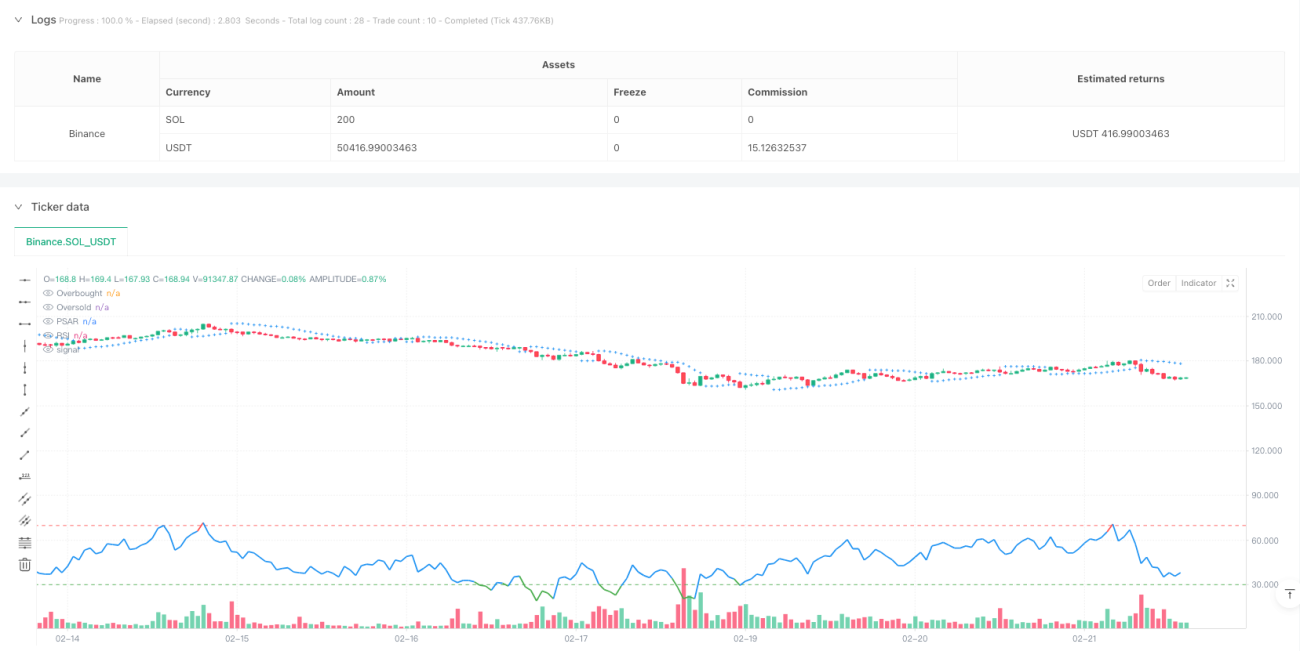
- Tín hiệu vào: Hệ thống phát ra nhiều tín hiệu khi giá vượt qua PSAR và RSI nằm trong phạm vi bán tháo (<30)
- Tín hiệu xuất cảnh: Khi giá giảm xuống dưới PSAR và RSI nằm trong phạm vi quá mua (<70) hệ thống phát ra tín hiệu cân bằng
- Kiểm soát rủi ro: Thiết lập 5% dừng và 3% dừng cho mỗi giao dịch, có thể điều chỉnh theo nhu cầu thực tế
- Hình ảnh tín hiệu: Chỉ số RSI hiển thị trực quan tình trạng thị trường thông qua mã hóa màu động (xanh là quá bán, đỏ là quá mua, xanh là trung tính)
- Ghi nhớ giao dịch: Ghi nhớ giao dịch tự động khi kích hoạt tín hiệu mua bán
Lợi thế chiến lược
- Tín hiệu đáng tin cậy: Giảm hiệu quả tín hiệu giả mạo bằng cách kết hợp xác nhận kép PSAR và RSI
- Kiểm soát rủi ro: Cấu trúc dừng lỗ tích hợp, hạn chế tổn thất trên một giao dịch
- Hoạt động rõ ràng: thiết kế giao diện trực quan, tín hiệu giao dịch trực quan rõ ràng
- Khả năng thích ứng: Các tham số có thể điều chỉnh để phù hợp với các môi trường thị trường khác nhau
- Mức độ tự động hóa cao: hỗ trợ giao dịch tự động và phân tích phản hồi
Rủi ro chiến lược
- Không áp dụng cho thị trường rung động: có thể xảy ra giao dịch thường xuyên trong thị trường rung động ngang
- Tác động trượt: Có thể có nguy cơ trượt lớn hơn trong môi trường có tỷ lệ biến động cao
- Nhận thức tham số: Sự kết hợp các tham số khác nhau có thể dẫn đến sự khác biệt lớn trong hiệu suất chiến lược
- Rủi ro dừng lỗ: Mức dừng lỗ cố định có thể không linh hoạt trong một số điều kiện thị trường
- Tín hiệu chậm trễ: Chỉ số tự nó có một chút chậm trễ, có thể bỏ lỡ thời điểm tốt nhất để vào
Hướng tối ưu hóa chiến lược
- Tiếp tục đưa ra phán đoán về môi trường thị trường: tăng các chỉ số cường độ xu hướng, sử dụng các tham số khác nhau trong các môi trường thị trường khác nhau
- Cài đặt dừng động: Tự động điều chỉnh vị trí dừng tùy theo biến động của thị trường
- Tối ưu hóa quản lý vị trí: giới thiệu hệ thống quản lý vị trí động, điều chỉnh tỷ lệ mở vị trí theo đánh giá rủi ro
- Thêm bộ lọc thời gian: thêm cửa sổ thời gian giao dịch để tránh giao dịch trong thời gian bất lợi
- Cơ chế xác nhận tín hiệu: tăng số lượng giao dịch, tăng tín hiệu đáng tin cậy
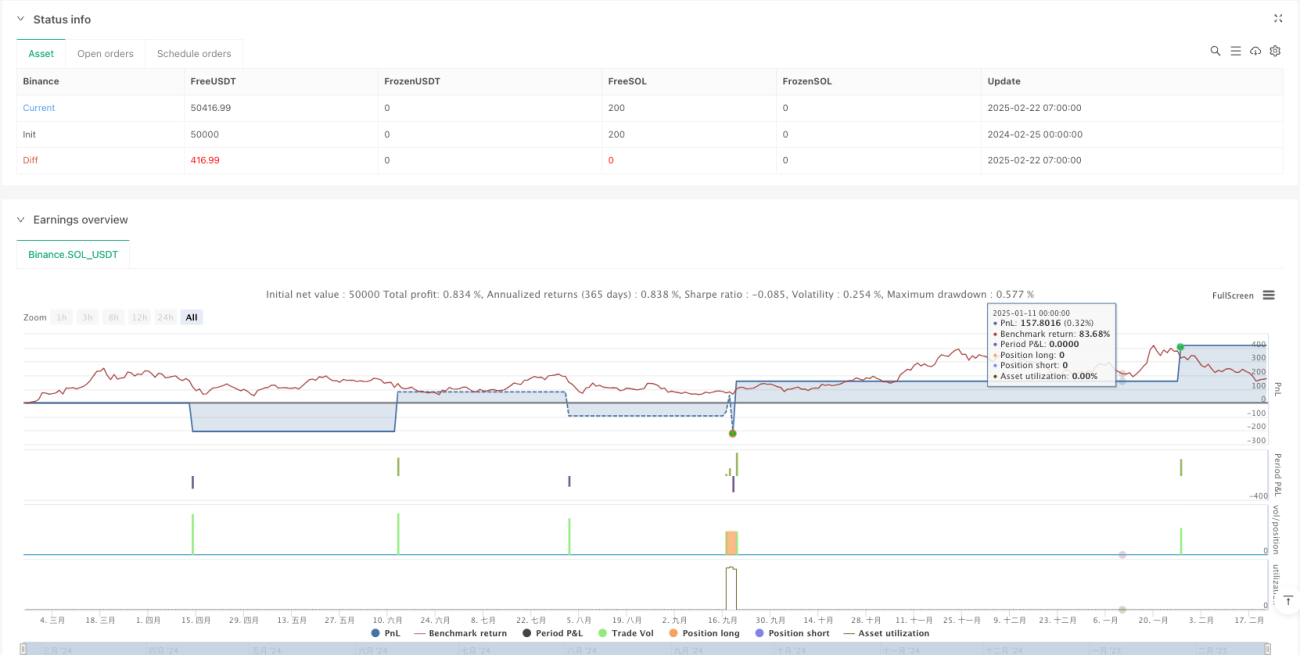
Tóm tắt
Chiến lược này tạo ra một hệ thống giao dịch hoàn chỉnh bằng cách kết hợp các chỉ số PSAR và RSI. Ưu điểm của nó là tín hiệu rõ ràng, rủi ro có thể kiểm soát được, nhưng vẫn cần chú ý đến sự thích ứng với môi trường thị trường. Bằng cách tối ưu hóa liên tục và điều chỉnh tham số, chiến lược có khả năng đạt được hiệu quả giao dịch tốt hơn.
/*backtest
start: 2024-02-25 00:00:00
end: 2025-02-22 08:00:00
period: 1h
basePeriod: 1h
exchanges: [{"eid":"Binance","currency":"SOL_USDT"}]
*/

//@version=5
strategy("PSAR & RSI Strategy with Risk Management", overlay=true, default_qty_type=strategy.percent_of_equity, default_qty_value=10)

// User Inputs- 1