Nhiều chỉ báo kỹ thuật để phát hiện biến động giá vàng theo thời gian thực và chiến lược quản lý rủi ro

MA EMA ATR STC HEIKIN ASHI CHANDELIER EXIT supertrend RMA VWMA WMA HMA
Ngày tạo: 2025-03-05 10:35:15 sửa đổi lần cuối: 2025-03-05 10:35:15
sao chép: 4 Số nhấp chuột: 548
2
tập trung vào
319
Người theo dõi

Nhiều chỉ báo kỹ thuật để phát hiện biến động giá vàng theo thời gian thực và chiến lược quản lý rủi ro Nhiều chỉ báo kỹ thuật để phát hiện biến động giá vàng theo thời gian thực và chiến lược quản lý rủi ro

Tổng quan về chiến lược

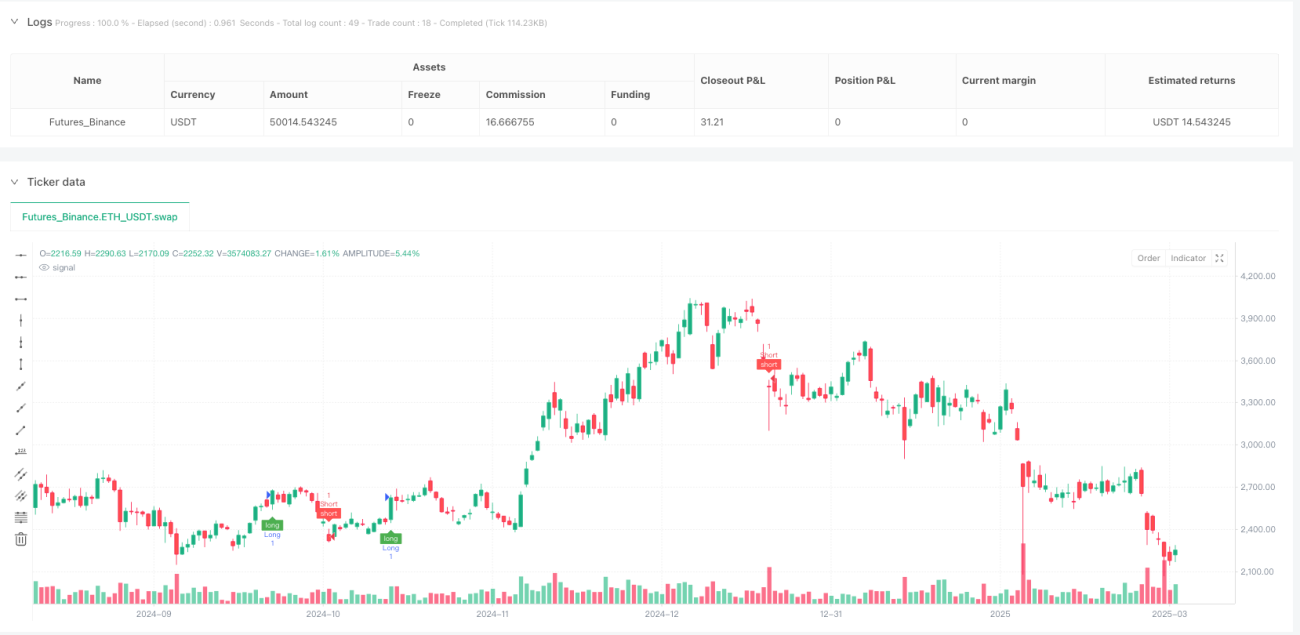
Chiến lược này chủ yếu sử dụng các chỉ số xuất phát của Candlelier Exit làm chỉ số chính, và có thể kết hợp các chỉ số như Bộ lọc EMA, Xu hướng siêu lớn (SuperTrend) và Chu kỳ xu hướng cát (Schaff Trend Cycle) như các công cụ xác nhận. Chiến lược này sử dụng cơ chế dừng lỗ linh hoạt và cung cấp một bảng điều khiển giao dịch trực quan, cho phép các nhà giao dịch giám sát tình trạng giao dịch trong thời gian thực. Phương pháp phân tích kỹ thuật đa chiều này được thiết kế để nắm bắt nhanh chóng các biến động ngắn hạn của giá vàng, đồng thời xác nhận các tín hiệu giả mạo thông qua hệ thống chỉ số.

Nguyên tắc chiến lược

Chiến lược này dựa trên hệ thống xác nhận tín hiệu nhiều tầng, logic cốt lõi như sau:

  1. Tạo tín hiệu chỉ số chínhChiến lược sử dụng CHANDELLIER EXIT làm chỉ số chính. CHANDELLIER EXIT là một chỉ số theo dõi xu hướng sử dụng ATR (Mức độ thực tế trung bình) để xác định vị trí dừng lỗ và tạo ra tín hiệu đa đầu và không đầu.

  2. Xác định bộ lọc chỉ sốChiến lược cho phép các nhà giao dịch chọn lựa nhiều chỉ số xác nhận:

    • Bộ lọc EMA: Giá cần nằm trên dòng EMA được chỉ định (trên) hoặc dưới (trên)
    • Siêu xu hướng (SuperTrend): cần phải phù hợp với hướng tín hiệu thống trị
    • Chu kỳ xu hướng STC: cần cao hơn giới trên (multi-head) hoặc thấp hơn giới dưới (blank head)
  3. Cơ chế hết hạn tín hiệuChiến lược: Có chức năng hết hạn tín hiệu, có thể thiết lập số tín hiệu hiệu quả, ngăn chặn giao dịch trên tín hiệu cũ.

  4. Logic thực hiện giao dịch: Khi đáp ứng tất cả các điều kiện được chọn, chiến lược tạo ra tín hiệu ra sân và tự động thiết lập điểm dừng dừng với số điểm cố định.

  5. Tối ưu hóa xử lý dữ liệuChiến lược sử dụng hàm EMA và SMA lấy mẫu theo điều kiện, và bộ lọc phạm vi chuyên dụng, cải thiện hiệu quả tính toán của chỉ số kỹ thuật.

  6. Hệ thống hình ảnh: Cung cấp bảng điều khiển giao dịch hiển thị trạng thái của các chỉ số và đánh dấu tín hiệu giao dịch và vị trí dừng lỗ trên biểu đồ.

Lợi thế chiến lược

  1. Cơ chế xác nhận đa dạng: Bằng cách xác nhận nhiều chỉ số, giảm đáng kể các tín hiệu giả và tăng độ chính xác giao dịch. Khi nhiều chỉ số cùng xác nhận một hướng, tín hiệu giao dịch sẽ đáng tin cậy hơn.

  2. Gói chỉ số linh hoạt: Người dùng có thể tự do chọn bật hoặc tắt các chỉ số xác nhận khác nhau, tùy chỉnh chiến lược hoạt động theo các điều kiện thị trường khác nhau.

  3. Quản lý rủi ro chính xácChiến lược: cho phép người dùng thiết lập số điểm dừng lỗ cụ thể, giúp kiểm soát chính xác tỷ lệ rủi ro / lợi nhuận cho mỗi giao dịch.

  4. Kiểm soát tín hiệu hết hạnChiến lược tránh giao dịch trên tín hiệu hết hạn bằng cách đặt tín hiệu có hiệu lực, giảm nguy cơ bị chậm trễ.

  5. Giao diện giao dịch có khả năng hiển thị cao: Đàn giao dịch trực quan hiển thị trạng thái của tất cả các chỉ số, giúp các nhà giao dịch đánh giá nhanh chóng các điều kiện thị trường.

  6. Tối ưu hóa thị trường vàngChiến lược này được tối ưu hóa các tham số cho các đặc điểm của thị trường vàng, đặc biệt là tính toán chuyển đổi giá trị điểm ((1 điểm = 0.1 đô la)) [2].

  7. Tính thích ứng giao dịch tần số caoChu kỳ thời gian 1 phút cho phép chiến lược nắm bắt biến động giá ngắn hạn, phù hợp với các nhà giao dịch trong ngày.

Rủi ro chiến lược

  1. Rủi ro giao dịch quá mứcChu kỳ 1 phút có thể tạo ra quá nhiều tín hiệu giao dịch, dẫn đến tăng chi phí giao dịch và giao dịch quá mức. Giải pháp là điều chỉnh số lượng chỉ số xác nhận hoặc tăng điều kiện lọc tín hiệu.

  2. Ảnh hưởng của tiếng ồn thị trường: Chu kỳ thời gian thấp dễ bị nhiễu bởi tiếng ồn thị trường, tạo ra tín hiệu giả. Ưu tiên sử dụng thận trọng trong thời gian biến động cao hoặc xác nhận xu hướng kết hợp với chu kỳ dài hơn.

  3. Sự chậm trễ của các chỉ số chồng chất: Xác nhận nhiều chỉ số mặc dù làm giảm tín hiệu giả, nhưng cũng làm tăng độ chậm trễ của hệ thống, có thể dẫn đến việc bỏ lỡ một số cơ hội kiếm tiền. Bạn có thể xem xét giảm số lượng chỉ số xác nhận để tăng tốc độ phản ứng.

  4. Hạn chế của lỗ dừng cố địnhLưu ý: Lệnh dừng của số điểm cố định không tính đến sự biến động của thị trường, có thể dừng quá gần trong thời gian biến động cao và dừng quá xa trong thời gian biến động thấp. Đề xuất điều chỉnh giá trị dừng theo động thái ATR hiện tại.

  5. Rủi ro đặc biệt của thị trường vàngThị trường vàng bị ảnh hưởng bởi nhiều yếu tố kinh tế vĩ mô, bao gồm dữ liệu lạm phát, chính sách ngân hàng trung ương, địa chính trị, và nhiều yếu tố khác. Phân tích kỹ thuật thuần túy có thể bỏ qua những ảnh hưởng này.

  6. Sự phụ thuộc của chỉ số chínhChiến lược phụ thuộc quá nhiều vào xuất khẩu Taiwan như một chỉ số chủ đạo, có thể không hoạt động tốt trong thị trường khu vực.

Hướng tối ưu hóa chiến lược

  1. Chỉ số đa dạngChiến lược hiện tại chỉ hỗ trợ xuất khẩu Taiwan làm chỉ số chính, có thể mở rộng hỗ trợ nhiều lựa chọn chỉ số chính, chẳng hạn như BRI, MACD hoặc Đường trung bình di chuyển thích ứng, để thích ứng với các môi trường thị trường khác nhau.

  2. Động lực dừng dừng: Thay đổi dừng dừng số điểm cố định thành dừng dừng động dựa trên ATR, có thể thích ứng tốt hơn với sự biến động của thị trường. Ví dụ: có thể sử dụngsl_value = atr(14) * 1.5Thay vì số điểm cố định.

  3. Tích hợp bộ lọc thời gianTăng bộ lọc thời gian giao dịch, tránh thời gian thiếu thanh khoản hoặc thời gian công bố tin tức quan trọng, có thể giảm nguy cơ trượt và biến động giá bất ngờ.

  4. Thêm phân tích khối lượng: Chỉ số khối lượng giao dịch tích hợp có thể xác minh cường độ chuyển động giá, cải thiện chất lượng tín hiệu. Ví dụ, tín hiệu phá vỡ chỉ được xác nhận khi khối lượng giao dịch tăng lên.

  5. Tối ưu hóa học máy: Tiến hành các thuật toán học máy động điều chỉnh trọng lượng của các chỉ số, tùy thuộc vào tham số chiến lược thích ứng với hoạt động thị trường gần đây.

  6. Cơ chế phân loại: Thực hiện cơ chế nhập cảnh và xuất cảnh theo đợt, giảm rủi ro thời gian của một điểm nhập cảnh và xuất cảnh, ví dụ như lập kho ba lần và thanh toán ba lần.

  7. Xác nhận nhiều chu kỳ: Xác định xu hướng tăng thời gian cao hơn, chỉ mở vị trí theo hướng xu hướng thời gian cao, giảm rủi ro giao dịch ngược.

  8. Phân tích liên quan của chỉ số: Phân tích sự liên quan giữa các chỉ số được chọn, tránh sử dụng các chỉ số có liên quan cao như xác nhận, điều này có thể dẫn đến xác nhận nhiều lần của giả tưởng.

Tóm tắt

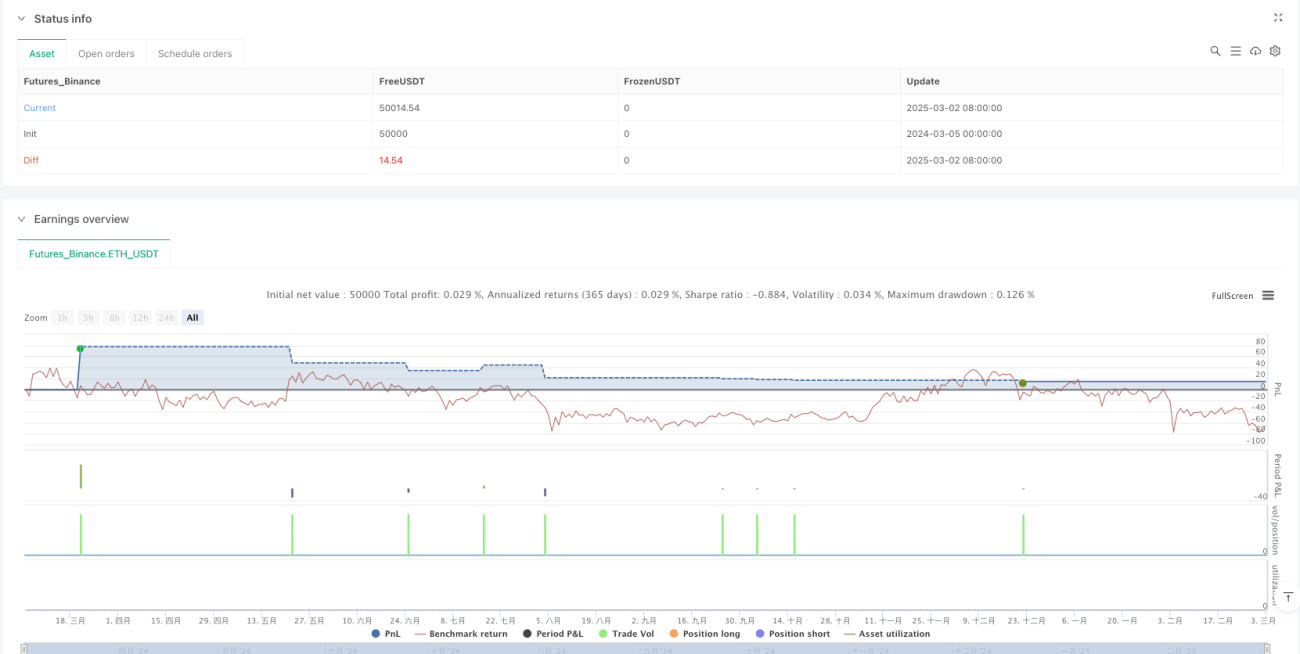
Chiến lược quản lý rủi ro là một hệ thống giao dịch phức hợp dành cho các nhà giao dịch ngắn hạn, cung cấp tín hiệu giao dịch đáng tin cậy hơn bằng cách tích hợp nhiều chỉ số kỹ thuật. Điểm mạnh cốt lõi của chiến lược là cơ chế xác nhận chỉ số linh hoạt và giao diện trực quan trực quan, cho phép các nhà giao dịch điều chỉnh các tham số chiến lược theo tình hình thị trường. Tuy nhiên, người dùng cần cảnh giác với các rủi ro vốn có của giao dịch thời gian ngắn, bao gồm cả giao dịch quá mức và ảnh hưởng của tiếng ồn thị trường.

Chiến lược này có thể được cải thiện hơn nữa bằng cách thực hiện các biện pháp tối ưu hóa được đề xuất, đặc biệt là các biện pháp dừng dừng động, xác nhận nhiều chu kỳ và đa dạng hóa các chỉ số chủ đạo. Chiến lược này cung cấp một khung phân tích kỹ thuật cho các nhà giao dịch trong ngày và những người yêu thích giao dịch vàng ngắn hạn, nhưng nó nên được sử dụng kết hợp với các nguyên tắc quản lý tài sản và hiểu biết cơ bản về thị trường để đạt được hiệu quả tối ưu.

Cuối cùng, sự thành công của giao dịch không chỉ phụ thuộc vào chính chiến lược mà còn phụ thuộc vào sự hiểu biết và thực hiện chính xác của nhà giao dịch. Việc phản hồi, tối ưu hóa và thích nghi với chiến lược liên tục là chìa khóa để đạt được kết quả giao dịch ổn định lâu dài.

Mã nguồn chiến lược
/*backtest
start: 2024-03-05 00:00:00
end: 2025-03-03 08:00:00
period: 1d
basePeriod: 1d
exchanges: [{"eid":"Futures_Binance","currency":"ETH_USDT"}]
*/

//@version=5
strategy("1 Min Gold Heikin Ashi Strategy", overlay=true, max_bars_back=500)

// Adjustable TP & SL in Pips
tp_pips = input.int(50, title="Take Profit (Pips)")
sl_pips = input.int(30, title="Stop Loss (Pips)")

// Convert pips to price value for XAUUSD (1 pip = 0.1 in Gold)
tp_value = tp_pips * 0.1
sl_value = sl_pips * 0.1

// Fixed components
justcontinue = bool(true)

ma(_source, _length, _type) => 
    switch _type
        "SMA"  => ta.sma (_source, _length)
        "EMA"  => ta.ema (_source, _length)
        "RMA"  => ta.rma (_source, _length)
        "WMA"  => ta.wma (_source, _length)
        "VWMA" => ta.vwma(_source, _length)

alarm(_osc, _message) => 
    alert(syminfo.ticker + ' ' + _osc + ' : ' + _message + ', price (' + str.tostring(close, format.mintick) + ')')

// Conditional Sampling EMA Function 
Cond_EMA(x, cond, n) =>
    var val = array.new_float(0)
    var ema_val = array.new_float(1)
    if cond
        array.push(val, x)
        if array.size(val) > 1
            array.remove(val, 0)
        if na(array.get(ema_val, 0))
            array.fill(ema_val, array.get(val, 0))
        array.set(ema_val, 0, (array.get(val, 0) - array.get(ema_val, 0)) * (2 / (n + 1)) + array.get(ema_val, 0))
    EMA = array.get(ema_val, 0)
    EMA

// Conditional Sampling SMA Function
Cond_SMA(x, cond, n) =>
    var vals = array.new_float(0)
    if cond
        array.push(vals, x)
        if array.size(vals) > n
            array.remove(vals, 0)
    SMA = array.avg(vals)
    SMA

// Standard Deviation Function
Stdev(x, n) =>
    math.sqrt(Cond_SMA(math.pow(x, 2), 1, n) - math.pow(Cond_SMA(x, 1, n), 2))

// Range Size Function
rng_size(x, scale, qty, n) =>
    ATR = Cond_EMA(ta.tr(true), 1, n)
    AC = Cond_EMA(math.abs(x - x[1]), 1, n)
    SD = Stdev(x, n)
    rng_size = scale == 'Pips' ? qty * 0.0001 : scale == 'Points' ? qty * syminfo.pointvalue : scale == '% of Price' ? close * qty / 100 : scale == 'ATR' ? qty * ATR : scale == 'Average Change' ? qty * AC : scale == 'Standard Deviation' ? qty * SD : scale == 'Ticks' ? qty * syminfo.mintick : qty
    rng_size

// Two Type Range Filter Function
rng_filt(h, l, rng_, n, type, smooth, sn, av_rf, av_n) =>
    rng_smooth = Cond_EMA(rng_, 1, sn)
    r = smooth ? rng_smooth : rng_
    var rfilt = array.new_float(2, (h + l) / 2)
    array.set(rfilt, 1, array.get(rfilt, 0))
    if type == 'Type 1'
        if h - r > array.get(rfilt, 1)
            array.set(rfilt, 0, h - r)
        if l + r < array.get(rfilt, 1)
            array.set(rfilt, 0, l + r)
    if type == 'Type 2'
        if h >= array.get(rfilt, 1) + r
            array.set(rfilt, 0, array.get(rfilt, 1) + math.floor(math.abs(h - array.get(rfilt, 1)) / r) * r)
        if l <= array.get(rfilt, 1) - r
            array.set(rfilt, 0, array.get(rfilt, 1) - math.floor(math.abs(l - array.get(rfilt, 1)) / r) * r)
    rng_filt1 = array.get(rfilt, 0)
    hi_band1 = rng_filt1 + r
    lo_band1 = rng_filt1 - r
    rng_filt2 = Cond_EMA(rng_filt1, rng_filt1 != rng_filt1[1], av_n)
    hi_band2 = Cond_EMA(hi_band1, rng_filt1 != rng_filt1[1], av_n)
    lo_band2 = Cond_EMA(lo_band1, rng_filt1 != rng_filt1[1], av_n)
    rng_filt = av_rf ? rng_filt2 : rng_filt1
    hi_band = av_rf ? hi_band2 : hi_band1
    lo_band = av_rf ? lo_band2 : lo_band1
    [hi_band, lo_band, rng_filt]

// Moving Average Function
ma_function(source, length, type) =>
    if type == 'RMA'
        ta.rma(source, length)
    else if type == 'SMA'
        ta.sma(source, length)
    else if type == 'EMA'
        ta.ema(source, length)
    else if type == 'WMA'
        ta.wma(source, length)
    else if type == 'HMA'
        if (length < 2)
            ta.hma(source, 2)
        else
            ta.hma(source, length)
    else 
        ta.vwma(source, length)

// Get Table Size
table_size(s) => 
    switch s
        "Auto"   => size.auto   
        "Huge"   => size.huge   
        "Large"  => size.large  
        "Normal" => size.normal 
        "Small"  => size.small
        => size.tiny

// Confirmation Setup
confirmation_counter = array.new_string(0)
confirmation_val = array.new_string(0)
confirmation_val_short = array.new_string(0)

pushConfirmation(respect, label, longCondition, shortCondition) =>
    if respect
        array.push(confirmation_counter, label)
        array.push(confirmation_val, longCondition ? "✔️" : "❌")
        array.push(confirmation_val_short, shortCondition ? "✔️" : "❌")

leadinglongcond = bool(na)
leadingshortcond = bool(na)
longCond = bool(na)
shortCond = bool(na)
longCondition = bool(na)
shortCondition = bool(na)

// Indicator Setup Inputs
setup_group = "████████ Indicator Setup ████████"
signalexpiry = input.int(defval=3, title='Signal Expiry Candle Count', group=setup_group, inline='expiry', tooltip="Number of candles to wait for all indicators to confirm a signal. Default is 3.")
alternatesignal = input.bool(true, "Alternate Signal", group=setup_group, inline='alternate')
showsignal = input.bool(true, "Show Long/Short Signal", group=setup_group, inline='showsignal', tooltip="Option to turn on/off the Long/Short signal shown on the chart.")
showdashboard = input.bool(true, "Show Dashboard", group=setup_group, inline='dashboard')

string i_tab1Ypos = input.string('bottom', 'Dashboard Position', group=setup_group, inline='dashboard2', options=['top', 'middle', 'bottom'])
string i_tab1Xpos = input.string('right', '', inline='dashboard2', group=setup_group, options=['left', 'center', 'right'])
in_dashboardtab_size = input.string(title="Dashboard Size", defval="Normal", options=["Auto", "Huge", "Large", "Normal", "Small", "Tiny"], group=setup_group, inline="dashboard3")

// Confirmation Indicator Settings
confirmation_group = "████████ Confirmation Indicators (filter) ████████"
respectce = input.bool(false, "Chandelier Exit", group=confirmation_group, inline='ce')
respectema = input.bool(false, "EMA Filter", group=confirmation_group, inline='respectema')
respectemaperiod = input.int(defval=200, minval=1, title='', group=confirmation_group, inline='respectema', tooltip="EMA filter for confirmation.")
respectst = input.bool(false, "SuperTrend", group=confirmation_group, inline='st')
respectstc = input.bool(false, "Schaff Trend Cycle (STC)", group=confirmation_group, inline='stc')

// Switchboard Indicators
switchboard_group = "████ Switch Board (Turn On/Off Overlay Indicators) ████"
switch_ema = input.bool(false, "EMA", group=switchboard_group, inline='Switch1')
switch_supertrend = input.bool(false, "Supertrend", group=switchboard_group, inline='Switch2')
switch_stc = input.bool(false, "STC", group=switchboard_group, inline='Switch3')

// ----------------------------------------
// 4. Indicator Code

// Chandelier Exit
////////////////////////////////////////////////
////// Chandelier Exit
///////////////////////////////////////////////
ChandelierE = "██████████ Chandelier Exit ██████████"
ce_length = input.int(title='ATR Period', defval=22, group=ChandelierE)
ce_mult = input.float(title='ATR Multiplier', step=0.1, defval=3.0, group=ChandelierE)
showLabels = input.bool(title='Show Buy/Sell Labels?', defval=true, group=ChandelierE)
useClose = input.bool(title='Use Close Price for Extremums?', defval=true, group=ChandelierE)
highlightState = input.bool(title='Highlight State?', defval=true, group=ChandelierE)

ce_atr = ce_mult * ta.atr(ce_length)
longStop = (useClose ? ta.highest(close, ce_length) : ta.highest(ce_length)) - ce_atr
longStopPrev = nz(longStop[1], longStop)
longStop := close[1] > longStopPrev ? math.max(longStop, longStopPrev) : longStop

shortStop = (useClose ? ta.lowest(close, ce_length) : ta.lowest(ce_length)) + ce_atr
shortStopPrev = nz(shortStop[1], shortStop)
shortStop := close[1] < shortStopPrev ? math.min(shortStop, shortStopPrev) : shortStop

var int dir = 1
dir := close > shortStopPrev ? 1 : close < longStopPrev ? -1 : dir

ce_long = dir == 1 
ce_short = dir == -1

// EMA Filter
////////////////////////////////////////////////////////////////////////////
//////////// EMA Filter
////////////////////////////////////////////////////////////////////////////
respectemavalue = ta.ema(close, respectemaperiod)
isaboverespectema = close > respectemavalue
isbelowrespectema = close < respectemavalue

// SuperTrend Calculation
////////////////////////////////
///// SuperTrend
//////////////////////////////
sp_group = "██████████ SuperTrend ██████████"
Periods = input.int(title='ATR Period', defval=10, group=sp_group)
stsrc = input.source(hl2, title='Source', group=sp_group)
Multiplier = input.float(title='ATR Multiplier', step=0.1, defval=3.0, group=sp_group)
changeATR = input.bool(title='Change ATR Calculation Method?', defval=true, group=sp_group)

statr2 = ta.sma(ta.tr, Periods)
statr = changeATR ? ta.atr(Periods) : statr2
stup = stsrc - Multiplier * statr
up1 = nz(stup[1], stup)
stup := close[1] > up1 ? math.max(stup, up1) : stup
dn = stsrc + Multiplier * statr
dn1 = nz(dn[1], dn)
dn := close[1] < dn1 ? math.min(dn, dn1) : dn
sttrend = 1
sttrend := nz(sttrend[1], sttrend)
sttrend := sttrend == -1 and close > dn1 ? 1 : sttrend == 1 and close < up1 ? -1 : sttrend
stbuySignal = sttrend == 1 and sttrend[1] == -1
stsellSignal = sttrend == -1 and sttrend[1] == 1

isstup = bool(na)
isstdown = bool(na)
isstup := sttrend == 1
isstdown := sttrend != 1

// Schaff Trend Cycle (STC)
/////////////////////////
/// STC overlay signal
/////////////////////////
stc_group = "██████████ Schaff Trend Cycle (STC) ██████████"
fastLength = input.int(title='MACD Fast Length', defval=23, group=stc_group)
slowLength = input.int(title='MACD Slow Length', defval=50, group=stc_group)
cycleLength = input.int(title='Cycle Length', defval=10, group=stc_group)
d1Length = input.int(title='1st %D Length', defval=3, group=stc_group)
d2Length = input.int(title='2nd %D Length', defval=3, group=stc_group)
srcstc = input.source(title='Source', defval=close, group=stc_group)
upper = input.int(title='Upper Band', defval=75, group=stc_group)
lower = input.int(title='Lower Band', defval=25, group=stc_group)
v_show_last  = input.int(2000, "Plotting Length", group=stc_group)

macd = ta.ema(srcstc, fastLength) - ta.ema(srcstc, slowLength)
k = nz(fixnan(ta.stoch(macd, macd, macd, cycleLength)))
d = ta.ema(k, d1Length)
kd = nz(fixnan(ta.stoch(d, d, d, cycleLength)))
stc = ta.ema(kd, d2Length)
stc := math.max(math.min(stc, 100), 0)

stcColor1 = stc > stc[1] ? color.green : color.red
stcColor2 = stc > upper ? color.green : stc <= lower ? color.red : color.orange

upperCrossover = ta.crossover(stc, upper)
upperCrossunder = ta.crossunder(stc, upper)
lowerCrossover = ta.crossover(stc, lower)
lowerCrossunder = ta.crossunder(stc, lower)
stcup = stc >= upper
stcdown = stc <= lower

// ----------------------------------------
// 5. Switchboard Code

// Additional code for EMA from Switchboard
/////////////////////////////////////////////////////////////////////////
// EMA Selection
/////////////////////////////////////////////////////////////////////////
ma_group= "██████████ MAs Line ██████████"

len1bool = input.bool(true, '', group=ma_group, inline='len1')
len1 = input.int(5, title='MA 1', group=ma_group, inline='len1')
string ma_1_type = input.string(defval='EMA', title='Type', options=['RMA', 'SMA', 'EMA', 'WMA', 'HMA', 'VWMA'], inline='len1', group=ma_group)
color ma_1_colour = input.color(color.rgb(254, 234, 74, 0), '', inline='len1', group=ma_group)

len2bool = input.bool(true, '', group=ma_group, inline='len2')
len2 = input.int(13, minval=1, title='MA 2', group=ma_group, inline='len2')
string ma_2_type = input.string(defval='EMA', title='Type', options=['RMA', 'SMA', 'EMA', 'WMA', 'HMA', 'VWMA'], inline='len2', group=ma_group)
color ma_2_colour = input.color(color.rgb(253, 84, 87, 0), '', inline='len2', group=ma_group)

len3bool = input.bool(false, '', group=ma_group, inline='len3')
len3 = input.int(20, minval=1, title='MA 3', group=ma_group, inline='len3')
string ma_3_type = input.string(defval='EMA', title='Type', options=['RMA', 'SMA', 'EMA', 'WMA', 'HMA', 'VWMA'], inline='len3', group=ma_group)
color ma_3_colour = input.color(color.new(color.aqua, 0), '', inline='len3', group=ma_group)

len4bool = input.bool(true, '', group=ma_group, inline='len4')
len4 = input.int(50, minval=1, title='MA 4', group=ma_group, inline='len4')
string ma_4_type = input.string(defval='EMA', title='Type', options=['RMA', 'SMA', 'EMA', 'WMA', 'HMA', 'VWMA'], inline='len4', group=ma_group)
color ma_4_colour = input.color(color.new(color.blue, 0), '', inline='len4', group=ma_group)

len5bool = input.bool(true, '', group=ma_group, inline='len5')
len5 = input.int(200, minval=1, title='MA 5', group=ma_group, inline='len5')
string ma_5_type = input.string(defval='EMA', title='Type', options=['RMA', 'SMA', 'EMA', 'WMA', 'HMA', 'VWMA'], inline='len5', group=ma_group)
color ma_5_colour = input.color(color.new(color.white, 0), '', inline='len5', group=ma_group)

// Request Security for MA calculations
ema1 = request.security(syminfo.tickerid, timeframe.period, ma_function(close, len1, ma_1_type))
ema2 = request.security(syminfo.tickerid, timeframe.period, ma_function(close, len2, ma_2_type))
ema3 = request.security(syminfo.tickerid, timeframe.period, ma_function(close, len3, ma_3_type))
ema4 = request.security(syminfo.tickerid, timeframe.period, ma_function(close, len4, ma_4_type))
ema5 = request.security(syminfo.tickerid, timeframe.period, ma_function(close, len5, ma_5_type))

// Plot the Moving Averages
plot(len1bool and switch_ema ? ema1 : na, color=ma_1_colour, linewidth=2, title='MA 1')
plot(len2bool and switch_ema ? ema2 : na, color=ma_2_colour, linewidth=2, title='MA 2')
plot(len3bool and switch_ema ? ema3 : na, color=ma_3_colour, linewidth=2, title='MA 3')
plot(len4bool and switch_ema ? ema4 : na, color=ma_4_colour, linewidth=2, title='MA 4')
plot(len5bool and switch_ema ? ema5 : na, color=ma_5_colour, linewidth=2, title='MA 5')

// Additional code for SuperTrend from switchboard
///////////////////////////////////////////////////
// SuperTrend - Switchboard
///////////////////////////////////////////////////
upPlot = plot(sttrend == 1 and switch_supertrend ? stup : na, title='Up Trend', style=plot.style_linebr, linewidth=2, color=color.new(color.green, 0))
plotshape(stbuySignal and switch_supertrend ? stup : na, title='UpTrend Begins', location=location.absolute, style=shape.circle, size=size.tiny, color=color.new(color.green, 0))

dnPlot = plot(sttrend != 1 and switch_supertrend ? dn : na, title='Down Trend', style=plot.style_linebr, linewidth=2, color=color.new(color.red, 0))
plotshape(stsellSignal and switch_supertrend ? dn : na, title='DownTrend Begins', location=location.absolute, style=shape.circle, size=size.tiny, color=color.new(color.red, 0))

// Additional code for Schaff Trend Cycle (STC) from switchboard
/////////////////////////////////////////////
// Schaff Trend Cycle (STC) - Switchboard
/////////////////////////////////////////////
plotshape(stcdown and switch_stc ? true : na, style=shape.circle, location=location.top, show_last=v_show_last, color=color.new(color.red, 0), title='STC Sell')
plotshape(stcup and switch_stc ? true : na, style=shape.circle, location=location.top, show_last=v_show_last, color=color.new(color.green, 0), title='STC Buy')

// ----------------------------------------
// 6. Declare and Initialize 'leadingindicator'
leadingindicator = input.string(title="Leading Indicator", defval="Chandelier Exit",
  options=["Chandelier Exit"], group="████████ Main Indicator (signal) ████████")

// 6. Leading Indicator Logic
if leadingindicator == 'Chandelier Exit'
    leadinglongcond := ce_long
    leadingshortcond := ce_short

// ----------------------------------------
// 7. Confirmation Indicator Logic
longCond := leadinglongcond
shortCond := leadingshortcond

longCond := longCond  and   (respectce ? ce_long : justcontinue)
shortCond := shortCond and   (respectce ? ce_short : justcontinue)

longCond := longCond  and   (respectema ? isaboverespectema : justcontinue)
shortCond := shortCond and   (respectema ? isbelowrespectema : justcontinue)

longCond := longCond  and   (respectst ? isstup : justcontinue)
shortCond := shortCond and   (respectst ? isstdown : justcontinue)

longCond := longCond  and   (respectstc ? stcup : justcontinue)


// ----------------------------------------
// 7. Confirmation Indicator Logic

longCond := leadinglongcond
shortCond := leadingshortcond

longCond := longCond  and   (respectce ? ce_long : justcontinue)
shortCond := shortCond and   (respectce ? ce_short : justcontinue)

longCond := longCond  and   (respectema ? isaboverespectema : justcontinue)
shortCond := shortCond and   (respectema ? isbelowrespectema : justcontinue)

longCond := longCond  and   (respectst ? isstup : justcontinue)
shortCond := shortCond and   (respectst ? isstdown : justcontinue)

longCond := longCond  and   (respectstc ? stcup : justcontinue)
shortCond := shortCond and   (respectstc ? stcdown : justcontinue)

// ----------------------------------------
// 8. Function to Update Dashboard Label

pushConfirmation(respectce, "Chandelier Exit", ce_long, ce_short)
pushConfirmation(respectema, "EMA", isaboverespectema, isbelowrespectema)
pushConfirmation(respectst, "SuperTrend", isstup, isstdown)
pushConfirmation(respectstc, "Schaff Trend Cycle", stcup, stcdown)

// ----------------------------------------
// 9. Final Part (Dashboard Table and Signal Plotting)

leadingstatus = leadinglongcond ? "✔️" : "❌"
leadingstatus_short = leadingshortcond ? "✔️" : "❌"

rowcount = int(na)
if array.size(confirmation_counter) == 0
    rowcount := 5
else
    rowcount := array.size(confirmation_counter) + 4

// Signal Expiry Logic
var int leadinglong_count = 0
var int leadinglong_count2 = 0
var int leadingshort_count = 0
var int leadingshort_count2 = 0

if leadinglongcond
    leadinglong_count := leadinglong_count + 1
    leadinglong_count2 := leadinglong_count

for i = 1 to 100
    if leadinglongcond[i]
        leadinglong_count := leadinglong_count + 1
        leadinglong_count2 := leadinglong_count
    else
        leadinglong_count := 0
        break

if leadingshortcond
    leadingshort_count := leadingshort_count + 1
    leadingshort_count2 := leadingshort_count

for i = 1 to 100
    if leadingshortcond[i]
        leadingshort_count := leadingshort_count + 1
        leadingshort_count2 := leadingshort_count
    else
        leadingshort_count := 0
        break

// Expiry Condition
CondIni = 0

// If expiry option is used
longcond_withexpiry = longCond and leadinglong_count2 <= signalexpiry
shortcond_withexpiry = shortCond and leadingshort_count2 <= signalexpiry

// Without expiry
longCondition := longcond_withexpiry and CondIni[1] == -1
shortCondition := shortcond_withexpiry and CondIni[1] == 1

if alternatesignal
    longCondition := longcond_withexpiry and CondIni[1] == -1  
    shortCondition := shortcond_withexpiry and CondIni[1] == 1 
else
    longCondition := longcond_withexpiry  
    shortCondition := shortcond_withexpiry 

CondIni := longcond_withexpiry ? 1 : shortcond_withexpiry ? -1 : CondIni[1]

// Check if expiry count is crossed
is_expiry_count_crossed_long = leadinglong_count2 >= signalexpiry 
is_expiry_count_crossed_short = leadingshort_count2 >= signalexpiry 

// Plot signals on chart
plotshape(showsignal ? (longCondition[1] ? false : longCondition) : na, title='Buy Signal', text='long', textcolor=color.new(color.white, 0), style=shape.labelup, size=size.tiny, location=location.belowbar, color=color.new(color.green, 0))
plotshape(showsignal ? (shortCondition[1] ? false : shortCondition) : na, title='Sell Signal', text='short', textcolor=color.new(color.white, 0), style=shape.labeldown, size=size.tiny, location=location.abovebar, color=color.new(color.red, 0))

// Alerts
alertcondition(longCondition, title='Buy Alert', message='BUY')
alertcondition(shortCondition, title='Sell Alert', message='SELL')
alertcondition(longCondition or shortCondition, title='Buy or Sell Alert', message="Buy or Sell Alert")

/// ----------------------------------------
// 10. Strategy Execution - Entries & Exits

// Use already declared TP & SL values (from the start of the script)

// Long Entry Conditions
if longCondition
    strategy.entry("Long", strategy.long)
    strategy.exit("TakeProfit_Long", from_entry="Long", limit=close + tp_value, stop=close - sl_value)

// Short Entry Conditions
if shortCondition
    strategy.entry("Short", strategy.short)
    strategy.exit("TakeProfit_Short", from_entry="Short", limit=close - tp_value, stop=close + sl_value)