
Tổng quan
Chiến lược này là một phương pháp giao dịch định lượng sáng tạo, tập trung vào việc nắm bắt tín hiệu giao dịch chính xác và quản lý rủi ro bằng cách kết hợp siêu xu hướng (Supertrend), chỉ số di chuyển trung bình (EMA) và chỉ số tương đối mạnh (RSI). Chiến lược này được thiết kế để cung cấp cho các nhà giao dịch một cơ chế theo dõi xu hướng thị trường năng động, đa chiều, có thể áp dụng linh hoạt trên biểu đồ 1 phút, 5 phút và 15 phút.
Nguyên tắc chiến lược
Các nguyên tắc cốt lõi của chiến lược dựa trên sự phối hợp của ba chỉ số kỹ thuật quan trọng:
- Siêu xu hướng (Supertrend): cung cấp phán đoán xu hướng thị trường bằng cách tính toán phạm vi biến động thực trung bình (ATR) và hướng biến động giá.
- Đường trung bình di chuyển chỉ số ((EMA): Là đường hỗ trợ / kháng cự động, giúp xác định vị trí của giá so với đường trung bình.
- Chỉ số tương đối mạnh (RSI): đánh giá động lực thị trường, xác định tình trạng quá mua và quá bán.
Chiến lược này tạo ra tín hiệu giao dịch thông qua phân tích tổng hợp của ba chỉ số:
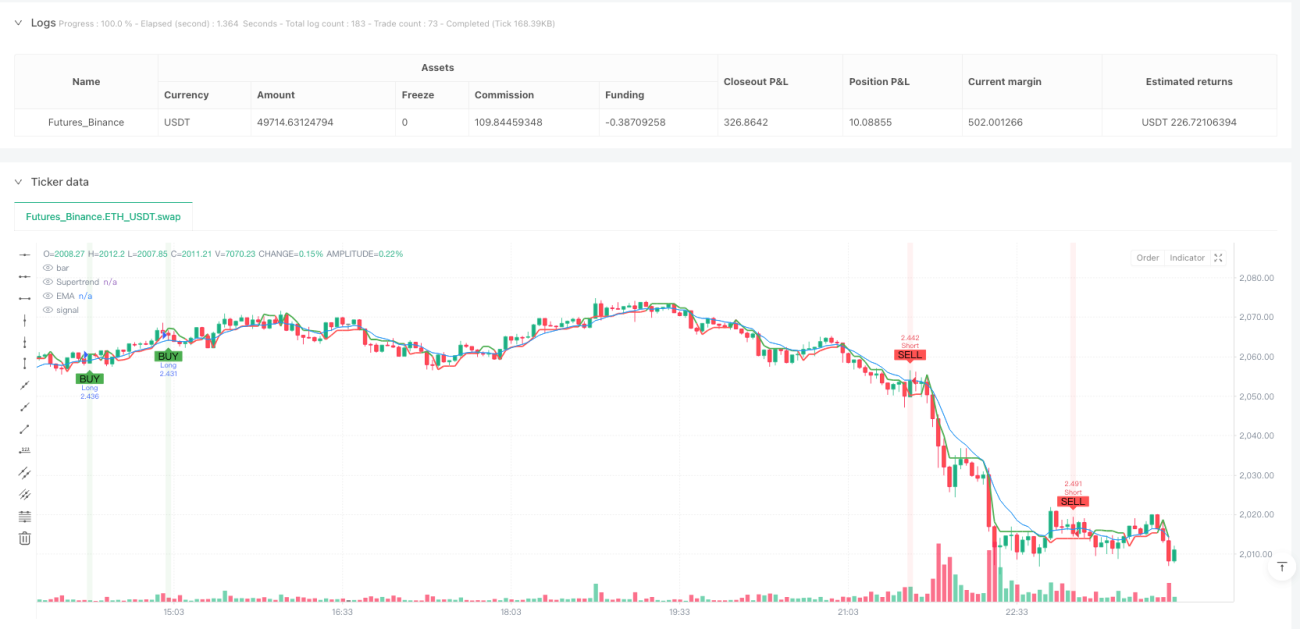
- Tạo nhiều tín hiệu: Xu hướng siêu là nhiều đầu + Giá cao hơn EMA + RSI cao hơn 40
- Tín hiệu giảm giá: Xu hướng siêu là giảm giá + giá thấp hơn EMA + RSI thấp hơn 60
Lợi thế chiến lược
- Xác nhận tín hiệu đa chiều: Xác nhận tín hiệu tăng đáng kể thông qua ba chỉ số chéo.
- Quản lý rủi ro động: Sử dụng cơ chế dừng và dừng dựa trên ATR, có thể thích ứng với biến động của thị trường.
- Tính linh hoạt: có thể được sử dụng một cách linh hoạt trong nhiều chu kỳ thời gian (khoảng 1 phút, 5 phút, 15 phút).
- Kiểm soát vị trí duy nhất: Chỉ cho phép một vị trí tại một thời điểm, kiểm soát rủi ro giao dịch hiệu quả.
- Hỗ trợ hình ảnh: cung cấp các biểu tượng tín hiệu mua và bán rõ ràng và bảng chỉ số quan trọng.
Rủi ro chiến lược
- Trễ tín chỉ số: Chỉ số kỹ thuật có một số phụ thuộc vào dữ liệu lịch sử, có thể gây ra sự chậm trễ tín hiệu.
- Tác động của biến động: Trong thị trường biến động cao, dừng lỗ có thể được kích hoạt thường xuyên.
- Tính nhạy cảm của tham số: Độ dài của ATR, chu kỳ EMA và mức giảm RSI có ảnh hưởng đáng kể đến hiệu suất chiến lược.
- Chi phí giao dịch: giao dịch thường xuyên có thể gây ra phí cao hơn.
Hướng tối ưu hóa chiến lược
- Các tham số thích ứng: giới thiệu thuật toán học máy, điều chỉnh các tham số động theo điều kiện thị trường.
- Gói đa không gian: kết hợp theo dõi xu hướng và chiến lược đảo ngược, cân bằng chiến lược ổn định.
- Phân phối rủi ro: Tối ưu hóa quản lý vị trí, giới thiệu kiểm soát kích thước vị trí động.
- Xác minh đa chu kỳ: Cơ chế xác minh tín hiệu thêm nhiều chu kỳ thời gian.
- Tối ưu hóa chi phí giao dịch: Giảm tần suất giao dịch, giảm giao dịch không cần thiết.
Tóm tắt
Đây là một chiến lược giao dịch định lượng kết hợp phân tích kỹ thuật đa chiều, cung cấp cho các nhà giao dịch một khung quyết định giao dịch năng động và linh hoạt thông qua sự phối hợp của xu hướng siêu, EMA và RSI. Điểm mạnh cốt lõi của chiến lược là xác thực nhiều tín hiệu và cơ chế quản lý rủi ro thích nghi, nhưng đồng thời cũng cần các nhà giao dịch liên tục tối ưu hóa và điều chỉnh.
/*backtest
start: 2025-03-24 00:00:00
end: 2025-03-27 00:00:00
period: 3m
basePeriod: 3m
exchanges: [{"eid":"Futures_Binance","currency":"ETH_USDT"}]
*/

//@version=6
strategy("SOL Scalper - Supertrend + EMA + RSI (One Position at a Time)", overlay=true, initial_capital=1000, default_qty_type=strategy.percent_of_equity, default_qty_value=10, commission_type=strategy.commission.percent, commission_value=0.075)

// Inputs- 1