
Tổng quan
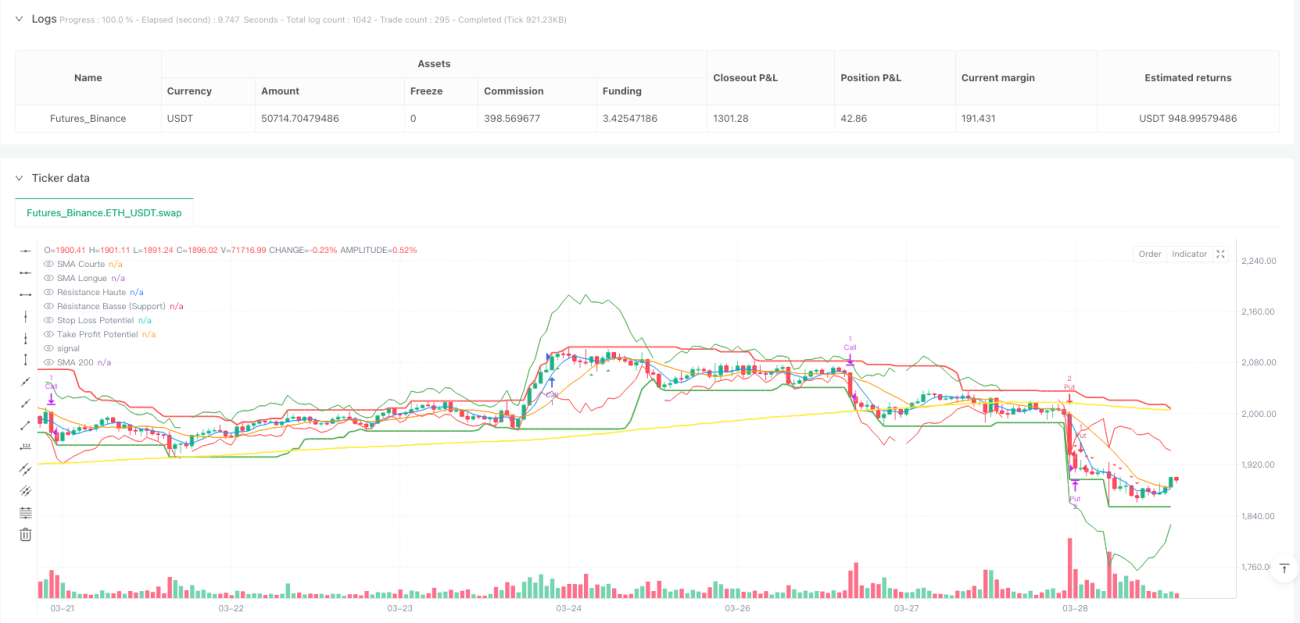
Chiến lược này là một chiến lược dự báo xu hướng ngắn hạn đa chiều, tập trung vào việc tận dụng hiệu ứng cộng hưởng của nhiều chỉ báo kỹ thuật để nhận diện và dự đoán những thay đổi xu hướng ngắn hạn trên thị trường tài chính. Chiến lược tích hợp các công cụ phân tích kỹ thuật chính như đường trung bình động đơn giản (SMA), chỉ số sức mạnh tương đối (RSI), chỉ số định hướng trung bình (ADX), dải biến động trung bình thực (ATR), chỉ báo MACD và bộ dao động ngẫu nhiên (Stochastic), nhằm nâng cao độ chính xác và độ tin cậy của các tín hiệu giao dịch.
Nguyên lý chiến lược
Nguyên lý cốt lõi của chiến lược dựa trên cơ chế phân tích cộng hưởng đa chỉ báo và xác nhận xu hướng. Các tín hiệu giao dịch được tạo ra bằng cách xem xét tổng hợp các yếu tố chính sau:
- Giao cắt của đường trung bình động ngắn hạn và dài hạn
- Trạng thái quá mua/quá bán của RSI
- Sự thay đổi của đường MACD và đường tín hiệu
- Chỉ số động lượng của bộ dao động ngẫu nhiên
- Cường độ xu hướng của ADX
- Xu hướng thị trường tổng thể của đường trung bình động 200 chu kỳ
- Biến động thị trường gần đây
Chiến lược tính toán động các điểm vào lệnh tiềm năng, mức cắt lỗ và chốt lời, đồng thời điều chỉnh các tham số chính này dựa trên biến động thị trường gần đây, từ đó thực hiện quản lý rủi ro và thực thi giao dịch.
Lợi thế của chiến lược
- Phân tích tổng hợp đa chỉ báo: Bằng cách tích hợp nhiều chỉ báo kỹ thuật, giảm thiểu rủi ro đánh giá sai do một chỉ báo đơn lẻ gây ra
- Quản lý rủi ro động: Cơ chế cắt lỗ và chốt lời dựa trên ATR, có thể điều chỉnh vị thế theo biến động thị trường
- Khung thời gian linh hoạt: Hỗ trợ các chu kỳ giao dịch khác nhau từ 5 phút đến 4 giờ
- Quy mô vị thế tự thích ứng: Điều chỉnh động kích thước vị thế dựa trên vốn khả dụng và tỷ lệ rủi ro trên mỗi giao dịch
- Xác nhận cường độ xu hướng: Xác nhận hiệu quả của xu hướng thông qua chỉ báo ADX, tránh giao dịch thường xuyên trên thị trường đi ngang
Rủi ro của chiến lược
- Sự phức tạp của đa chỉ báo có thể dẫn đến độ trễ trong việc tạo tín hiệu
- Trong môi trường thị trường biến động mạnh, các chỉ báo có thể đưa ra tín hiệu mâu thuẫn
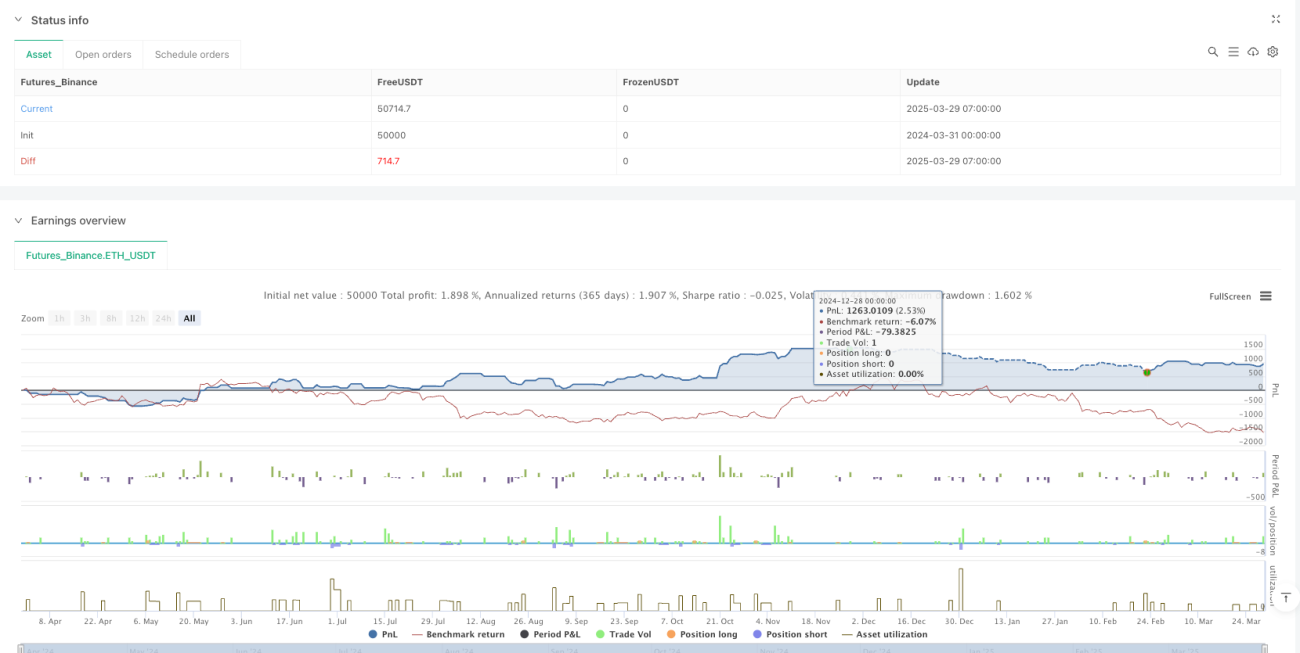
- Kết quả backtest có thể không đại diện hoàn toàn cho hiệu suất giao dịch thực tế trong tương lai
- Giao dịch sử dụng đòn bẩy có thể khuếch đại đáng kể thua lỗ
- Không xem xét các yếu tố cơ bản và các sự kiện thị trường bất ngờ
Hướng tối ưu hóa chiến lược
- Đưa vào các thuật toán học máy để điều chỉnh động trọng số của các chỉ báo
- Bổ sung thêm các chỉ báo cơ bản và tâm lý
- Phát triển các thuật toán quản lý vị thế thông minh hơn
- Tùy chỉnh tham số cá nhân hóa cho từng thị trường và loại tài sản
- Tích hợp phân tích tin tức thời thực và cảm xúc từ mạng xã hội
Tổng kết
Đây là một chiến lược dự báo xu hướng ngắn hạn đa chiều, dựa trên dữ liệu, thông qua sự kết hợp phức tạp của các chỉ báo kỹ thuật và cơ chế quản lý rủi ro động, nhằm nâng cao độ chính xác và độ tin cậy của các quyết định giao dịch. Mặc dù chiến lược có những lợi thế lý thuyết đáng kể, nhưng trong ứng dụng thực tế vẫn cần thận trọng và liên tục thực hiện backtest cũng như tối ưu hóa.
- 1