Tổng quan
Đây là một chiến lược giao dịch định lượng sáng tạo, cung cấp cho các nhà giao dịch một phương pháp giao dịch có cấu trúc bằng cách tích hợp đầu vào khu vực thanh khoản, giảm giá biến động ATR và quản lý rủi ro động. Chiến lược này kết hợp nhiều chỉ số phân tích kỹ thuật nhằm xác định các cơ hội giao dịch có xác suất cao và tự động tính toán mức dừng và dừng lỗ.
Nguyên tắc chiến lược
Các nguyên tắc cốt lõi của chiến lược này dựa trên các yếu tố then chốt sau:
- Phân tích vùng lưu động: Xác định vùng hỗ trợ và kháng cự tiềm năng bằng cách tính toán các điểm thấp nhất và cao nhất trong một chu kỳ nhất định.
- Bộ lọc tỷ lệ biến động ATR: Sử dụng phạm vi biến động thực trung bình ((ATR) làm ngưỡng động cho đầu vào và quản lý rủi ro.
- Bộ lọc xu hướng: kết hợp các chỉ số chuyển động 50 chu kỳ (EMA) và chỉ số tương đối mạnh (RSI) để xác nhận xu hướng và động lực của thị trường.
- Quản lý rủi ro động: tính toán tự động mức dừng và dừng lỗ theo ATR và cho phép điều chỉnh tỷ lệ rủi ro / lợi nhuận một cách linh hoạt.
Lợi thế chiến lược
- Tạo tín hiệu đa chiều: kết hợp tính linh hoạt, dao động và lọc xu hướng, cải thiện chất lượng tín hiệu.
- Quản lý rủi ro thích ứng: Định hướng động của lệnh dừng lỗ, kiểm soát rủi ro giao dịch hiệu quả.
- Thiết lập tham số linh hoạt: có thể tùy chỉnh độ dài ATR, chu kỳ thanh khoản và thời gian giao dịch.
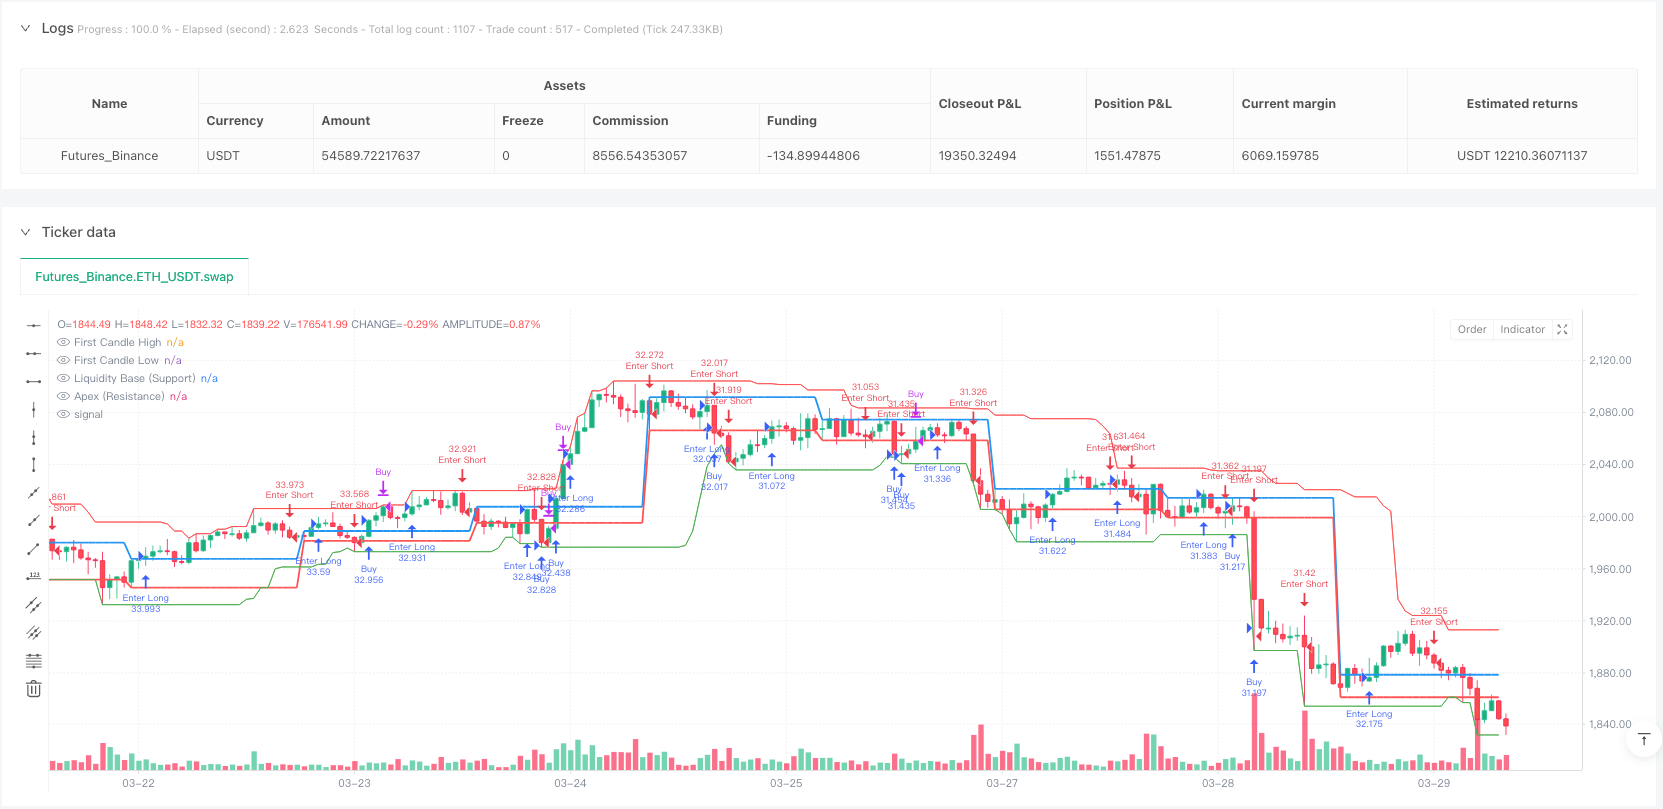
- Hỗ trợ hình ảnh: cung cấp hiển thị hình ảnh của dòng chảy và cấp độ K đầu tiên.
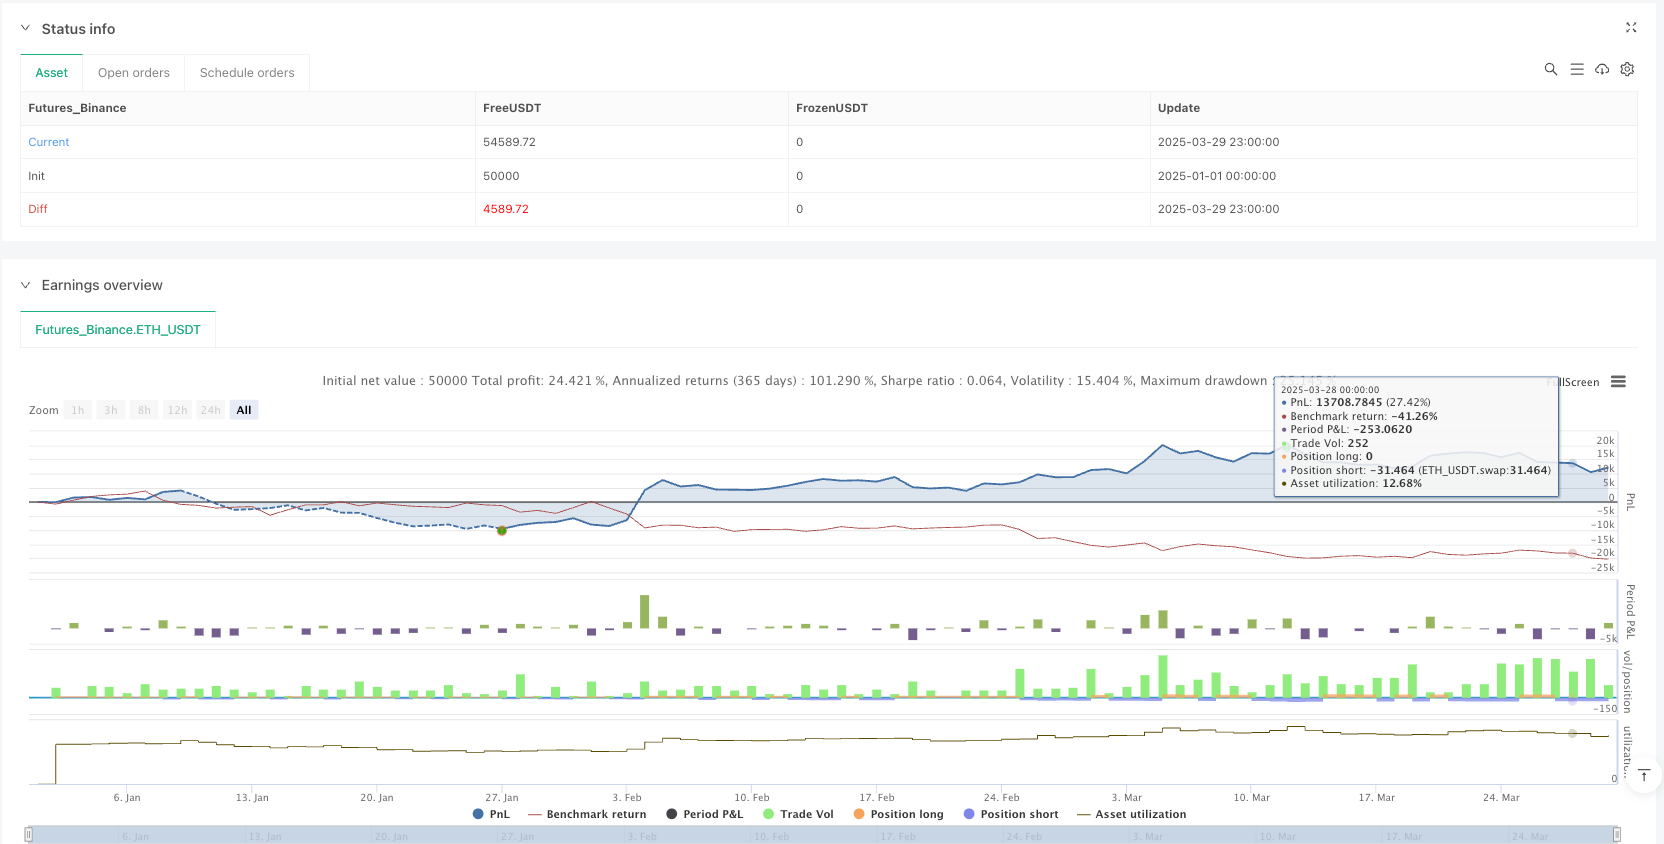
- Theo dõi hiệu suất: Bảng thống kê giao dịch tích hợp, hiển thị tỷ lệ thắng và thua trực tiếp trên biểu đồ.
Rủi ro chiến lược
- Nhận thức tham số: hiệu suất chiến lược phụ thuộc rất nhiều vào lựa chọn tham số, cần phải liên tục kiểm tra lại và tối ưu hóa.
- Thị trường thích ứng: Hiệu suất có thể không ổn định trong thị trường không có xu hướng rõ ràng hoặc biến động cao.
- Rủi ro đột phá giả mạo: Có thể có thông báo sai lầm về đột phá trong khu vực lưu động.
- Tần suất giao dịch: Bộ lọc phiên và nhiều điều kiện có thể làm giảm cơ hội giao dịch.
- Đánh giá: 64% số liệu lịch sử có thể không hoàn toàn đại diện cho hiệu suất trong tương lai.
Hướng tối ưu hóa chiến lược
- Tích hợp học máy: giới thiệu thuật toán học máy để điều chỉnh động các tham số và tạo tín hiệu.
- Khả năng thích ứng đa thị trường: Phát triển các thiết lập tham số phổ biến hơn cho các thị trường và giống khác nhau.
- Quản lý rủi ro sâu sắc: giới thiệu quy mô vị trí phức tạp hơn và thuật toán phân bổ rủi ro.
- Cơ chế xác nhận tín hiệu: thêm các chỉ số xác nhận bổ sung, chẳng hạn như khối lượng giao dịch hoặc các chỉ số kỹ thuật khác.
- Giám sát hiệu suất thời gian thực: Phát triển mô-đun đánh giá hiệu suất thời gian thực và điều chỉnh thích ứng.
Tóm tắt
Chiến lược giao dịch ThinkTech AI cung cấp cho các nhà giao dịch một công cụ giao dịch định lượng mạnh mẽ thông qua phương pháp đa yếu tố sáng tạo. Chiến lược này nhằm mục đích xác định các cơ hội giao dịch chất lượng cao thông qua phân tích thanh khoản, lọc tỷ lệ biến động và quản lý rủi ro động. Tuy nhiên, các nhà giao dịch cần phải liên tục đo lường, tối ưu hóa và áp dụng cẩn thận để phát huy đầy đủ tiềm năng của chiến lược.
/*backtest
start: 2025-01-01 00:00:00
end: 2025-03-30 00:00:00
period: 1h
basePeriod: 1h
exchanges: [{"eid":"Futures_Binance","currency":"ETH_USDT"}]
*/

if high > ta.highest(high[1], 5)
    strategy.entry("Enter Long", strategy.long)
else if low < ta.lowest(low[1], 5)
    strategy.entry("Enter Short", strategy.short)//@version=6
strategy("ThinkTech AI Signals", overlay=true, initial_capital=100000, default_qty_type=strategy.percent_of_equity, default_qty_value=100)

//──────────────────────────────
// Input Settings
//──────────────────────────────
riskRewardRatio    = input.float(title="Risk/Reward Ratio", defval=2.0, minval=1.0, step=0.1)

// Inputs from second script
liquidity_period   = input.int(20, title="Liquidity Base Period")
atr_length         = input.int(14, title="ATR Length")
atr_threshold      = input.float(0.3, title="ATR Breakout Threshold")
take_profit_mult   = input.float(0.25, title="Take-Profit Multiplier")
stop_loss_mult     = input.float(0.75, title="Stop-Loss Multiplier")
vol_filter         = input.bool(true, title="Enable Volume Filter")
session_filter     = input.bool(true, title="Limit to Trading Session")

// Additional inputs for further filtering and settings
atrMultiplier      = input.float(title="ATR Multiplier for Stop Loss", defval=1.5, minval=0.1, step=0.1)
retestCushionLong  = input.float(title="Retest Cushion Factor for BUY", defval=1.0, minval=1.0, step=0.001)
retestCushionShort = input.float(title="Retest Cushion Factor for SELL", defval=1.0, minval=0.0, maxval=1.0, step=0.001)
useTrendFilter     = input.bool(title="Use 50 EMA Trend Filter", defval=true)
useRSIFilter       = input.bool(title="Use RSI Filter", defval=false)
rsiPeriod          = input.int(title="RSI Period", defval=14, minval=1)
rsiOversold        = input.float(title="RSI Oversold Level", defval=30.0, minval=1, maxval=50)
rsiOverbought      = input.float(title="RSI Overbought Level", defval=70.0, minval=50, maxval=100)

// Option to remove plotted lines
showLiquidityLines   = input.bool(true, title="Show Liquidity Lines")
showFirstCandleLines = input.bool(true, title="Show First Candle Level Lines")

//──────────────────────────────
// Calculations & Variables (Liquidity & ATR Based)
//──────────────────────────────
price        = close
atr          = ta.atr(atr_length)
vol_condition = volume > ta.sma(volume, 20)

// Define Liquidity Base and Apex for support/resistance
liquidity_base = ta.lowest(low, liquidity_period)
apex           = ta.highest(high, liquidity_period)
// Track recent highs and lows for filtering
hh = ta.highest(high, 30)
ll = ta.lowest(low, 30)

//──────────────────────────────
// Trade Stats Variables
//──────────────────────────────
var float take_profit = na
var float stop_loss   = na
var bool  in_trade    = false
var int   win_count   = 0
var int   loss_count  = 0

//──────────────────────────────
// ENTRY LOGIC (BUY) Based on Liquidity & ATR
//──────────────────────────────
breakout_up      = price > liquidity_base + (atr * atr_threshold)
point_of_release = ta.crossover(price, liquidity_base) and breakout_up
retest_buy       = price > liquidity_base and price < hh and not in_trade

// Session condition (e.g. trading between 9AM–12PM)
session_condition = (hour >= 9 and hour <= 12) or not session_filter

if (point_of_release or retest_buy) and (vol_condition or not vol_filter) and session_condition
    strategy.entry("Buy", strategy.long)
    take_profit := price + (atr * take_profit_mult)
    stop_loss   := liquidity_base - (atr * stop_loss_mult)
    in_trade    := true
    alert("Buy Signal - Price: " + str.tostring(price), alert.freq_once_per_bar)

//──────────────────────────────
// ENTRY LOGIC (SELL) Based on Liquidity & ATR
//──────────────────────────────
breakout_down = price < apex - (atr * atr_threshold)
clean_break   = ta.crossunder(price, apex) and breakout_down
retest_sell   = price < apex and price > ll and not in_trade

if (clean_break or retest_sell) and (vol_condition or not vol_filter) and session_condition
    strategy.entry("Sell", strategy.short)
    take_profit := price - (atr * take_profit_mult)
    stop_loss   := apex + (atr * stop_loss_mult)
    in_trade    := true
    alert("Sell Signal - Price: " + str.tostring(price), alert.freq_once_per_bar)

//──────────────────────────────
// EXIT LOGIC (For BUY & SELL)
//──────────────────────────────
if strategy.position_size > 0
    if price >= take_profit
        strategy.close("Buy", comment="Take Profit")
        win_count += 1
        in_trade := false
    if price <= stop_loss
        strategy.close("Buy", comment="Stop Loss")
        loss_count += 1
        in_trade := false

if strategy.position_size < 0
    if price <= take_profit
        strategy.close("Sell", comment="Take Profit")
        win_count += 1
        in_trade := false
    if price >= stop_loss
        strategy.close("Sell", comment="Stop Loss")
        loss_count += 1
        in_trade := false

//──────────────────────────────
// Plot Liquidity Lines (Support/Resistance)
//──────────────────────────────
plot(showLiquidityLines ? liquidity_base : na, color=color.green, title="Liquidity Base (Support)")
plot(showLiquidityLines ? apex : na, color=color.red, title="Apex (Resistance)")

//──────────────────────────────
// Debugging Signal Shapes
//──────────────────────────────
plotshape(series=point_of_release, location=location.belowbar, color=color.green, style=shape.triangleup, title="Buy Signal")
plotshape(series=clean_break, location=location.abovebar, color=color.red, style=shape.triangledown, title="Sell Signal")

//──────────────────────────────
// Win/Loss Table Display
//──────────────────────────────
var table t = table.new(position.top_right, 1, 2)
if bar_index == last_bar_index
    table.cell(t, 0, 0, "Wins: " + str.tostring(win_count), bgcolor=color.new(color.green, 80))
    table.cell(t, 0, 1, "Losses: " + str.tostring(loss_count), bgcolor=color.new(color.red, 80))

//──────────────────────────────
// Alert Conditions for Entries and Exits
//──────────────────────────────
alertcondition(point_of_release, title="Buy Alert", message="Buy Signal Triggered")
alertcondition(clean_break, title="Sell Alert", message="Sell Signal Triggered")
var int lastClosedTrades = 0
var bool exitSignal = false
if strategy.closedtrades > lastClosedTrades
    exitSignal := true
    lastClosedTrades := strategy.closedtrades
alertcondition(exitSignal, title="EXIT Signal", message="EXIT signal triggered: Trade has closed (TP or SL reached).")

//──────────────────────────────
// FIRST 15-MINUTE CANDLE CAPTURE (9:30–9:45 AM EST)
//──────────────────────────────
newDay = dayofmonth != dayofmonth[1]
var float fHigh = na
var float fLow  = na
var bool  firstCandleCaptured = false
if newDay
    fHigh := high
    fLow  := low
    firstCandleCaptured := true

//──────────────────────────────
// Additional Filters & Calculations
//──────────────────────────────
// Trend Filter: 50 EMA
ema50       = ta.ema(close, 50)
longFilter  = not useTrendFilter or (close > ema50)
shortFilter = not useTrendFilter or (close < ema50)

// ATR-Based Stop Loss Buffer
atrValue       = ta.atr(14)
stopLossBuffer = atrValue * atrMultiplier

// RSI Calculation (if enabled)
rsiValue = ta.rsi(close, rsiPeriod)

//──────────────────────────────
// ENTRY CONDITIONS (15-Minute Candle Retest)
//──────────────────────────────
// Breakout/Breakdown based on the first candle levels
buyBreakout   = firstCandleCaptured and ta.crossover(close, fHigh)
sellBreakdown = firstCandleCaptured and ta.crossunder(close, fLow)
// Retest conditions: price must retest the level after the breakout/breakdown
buyRetest  = firstCandleCaptured and (low <= fHigh) and (close > fHigh)
sellRetest = firstCandleCaptured and (high >= fLow) and (close < fLow)
// Final entry signals (with optional RSI filter)
buySignal  = buyBreakout and buyRetest and longFilter and (strategy.position_size == 0) and (not useRSIFilter or (rsiValue < rsiOversold))
sellSignal = sellBreakdown and sellRetest and shortFilter and (strategy.position_size == 0) and (not useRSIFilter or (rsiValue > rsiOverbought))

//──────────────────────────────
// Trade Parameters for 15-Minute Candle Retest
//──────────────────────────────
candleRange    = fHigh - fLow
stopLossBuy    = fLow - stopLossBuffer
takeProfitBuy  = fHigh + (candleRange * riskRewardRatio)
stopLossSell   = fHigh + stopLossBuffer
takeProfitSell = fLow - (candleRange * riskRewardRatio)

//──────────────────────────────
// Execute Trades for 15-Minute Candle Retest
//──────────────────────────────
if buySignal
    strategy.entry("BUY", strategy.long)
    strategy.exit("TP/SL BUY", "BUY", stop=stopLossBuy, limit=takeProfitBuy)

if sellSignal
    strategy.entry("SELL", strategy.short)
    strategy.exit("TP/SL SELL", "SELL", stop=stopLossSell, limit=takeProfitSell)

//──────────────────────────────
// Plot First Candle Level Lines (Optional)
//──────────────────────────────
plot(showFirstCandleLines and firstCandleCaptured ? fHigh : na, title="First Candle High", color=color.blue, linewidth=2)
plot(showFirstCandleLines and firstCandleCaptured ? fLow : na, title="First Candle Low", color=color.red, linewidth=2)