
Tổng quan
Chiến lược giao dịch PowerZone là một phương pháp giao dịch tự động sáng tạo, tập trung vào việc nắm bắt các biến động giá mạnh trên thị trường. Bằng cách xác định các vùng giá cụ thể (gọi là "PowerZones"), chiến lược này cung cấp cho nhà giao dịch các tín hiệu vào và ra rõ ràng, đồng thời có cơ chế quản lý rủi ro tích hợp.
Nguyên lý chiến lược
Cốt lõi của chiến lược nằm ở việc xác định hai loại PowerZone chính:
-
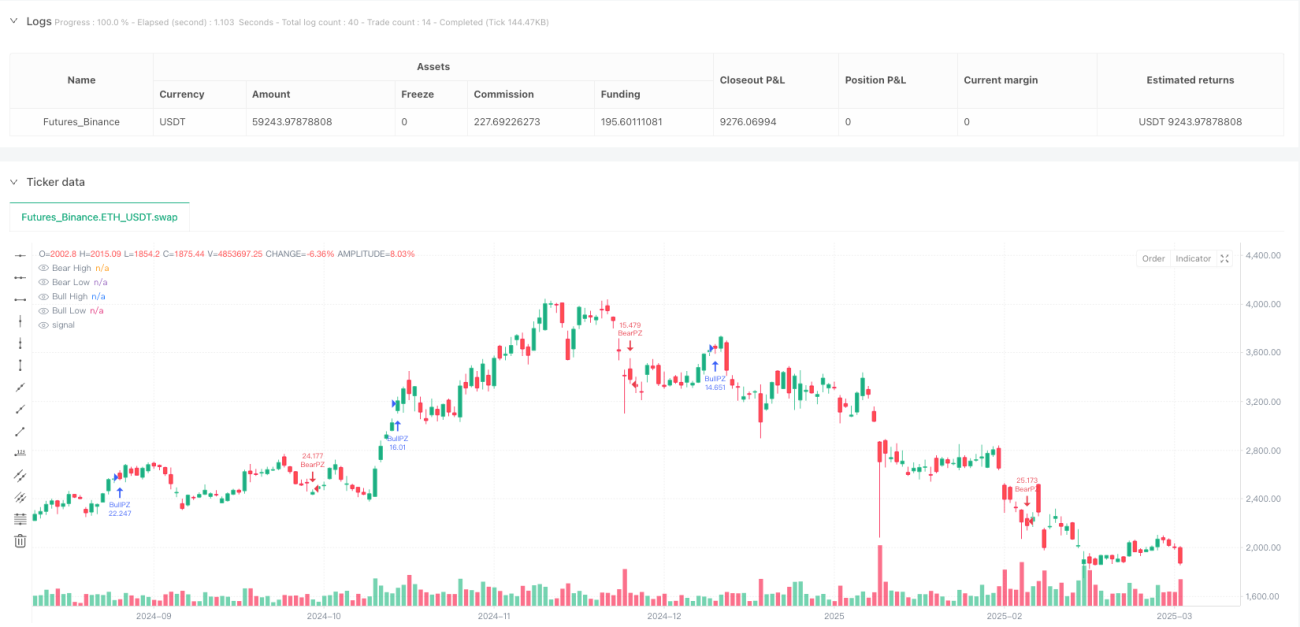
PowerZone tăng giá (Bullish PowerZone):
- Ban đầu là một nến giảm (giá đóng cửa thấp hơn giá mở cửa)
- Sau đó liên tiếp một số nến (mặc định 5 nến) có xu hướng tăng
- Tổng biến động giá vượt quá ngưỡng cài đặt trước (mặc định 2%)
-
PowerZone giảm giá (Bearish PowerZone):
- Ban đầu là một nến tăng (giá đóng cửa cao hơn giá mở cửa)
- Sau đó liên tiếp một số nến có xu hướng giảm
- Tổng biến động giá vượt quá ngưỡng cài đặt trước
Ưu điểm của chiến lược
- Tự động hóa việc xác định điểm đảo chiều xu hướng
- Tích hợp chức năng tùy chỉnh tham số linh hoạt
- Hiển thị trực quan rõ ràng
- Quản lý rủi ro tự động (chốt lời/cắt lỗ)
- Phù hợp với nhiều môi trường thị trường
- Mã nguồn gọn nhẹ, dễ hiểu và dễ sửa đổi
Rủi ro của chiến lược
- Thiết lập tham số không phù hợp có thể dẫn đến giao dịch quá mức
- Trong thị trường đi ngang có thể tạo ra tín hiệu sai
- Khối lượng cố định có thể làm tăng rủi ro thua lỗ mỗi lệnh
- Thiếu cơ chế lọc phức tạp
- Chưa xem xét xu hướng và chu kỳ thị trường rộng hơn
Hướng tối ưu hóa chiến lược
-
Bổ sung điều kiện lọc phụ
- Kết hợp chỉ báo xu hướng (ví dụ: EMA)
- Tích hợp chỉ báo động lượng (ví dụ: RSI)
- Thêm cơ chế xác nhận khối lượng
-
Quản lý khối lượng động
- Điều chỉnh kích thước vị thế dựa trên biến động thị trường
- Thực hiện kiểm soát khối lượng theo phần trăm rủi ro
-
Xác nhận trên nhiều khung thời gian
- Xác thực chéo tín hiệu trên các khung thời gian khác nhau
- Nâng cao độ tin cậy của tín hiệu
Kết luận
Chiến lược giao dịch PowerZone cung cấp cho nhà giao dịch một phương pháp giao dịch có cấu trúc thông qua việc xác định một cách hệ thống các vùng giá mạnh. Ưu điểm cốt lõi của nó là tự động hóa, trực quan hóa và tính linh hoạt, nhưng đồng thời cần điều chỉnh tham số một cách thận trọng và liên tục tối ưu hóa cơ chế quản lý rủi ro.
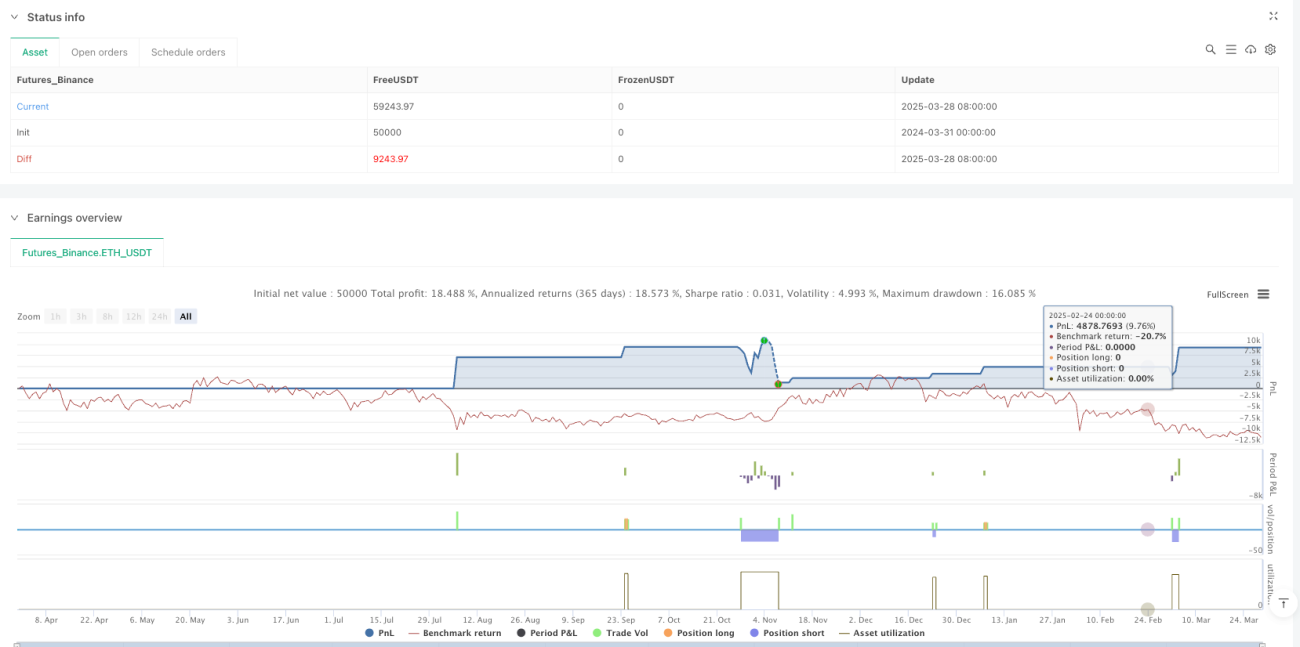
/*backtest
start: 2024-03-31 00:00:00
end: 2025-03-29 08:00:00
period: 1d
basePeriod: 1d
exchanges: [{"eid":"Futures_Binance","currency":"ETH_USDT"}]
*/

// This Pine Script® code is subject to the terms of the Mozilla Public License 2.0 at https://mozilla.org/MPL/2.0/
// © tradingbauhaus

//@version=6- 1