
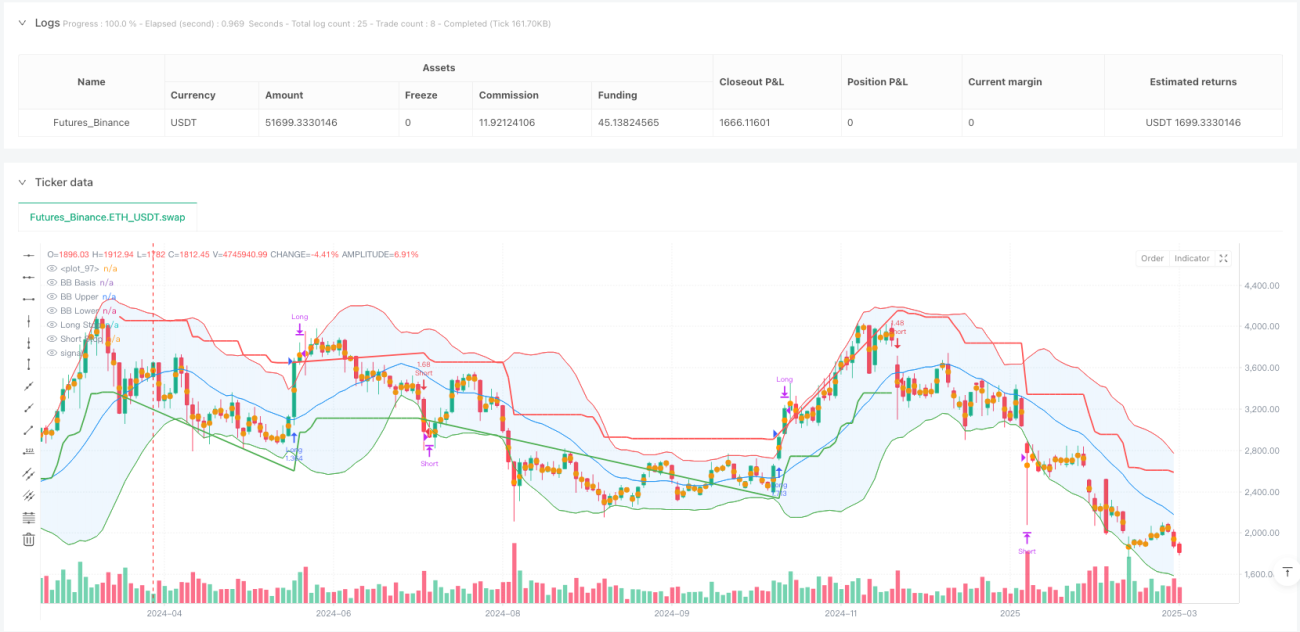
Bài viết này giới thiệu một chiến lược giao dịch tổng hợp kết hợp các chỉ số Bollinger Bands và SuperTrend. Chiến lược này nhằm cung cấp các tín hiệu vào và ra thị trường chính xác hơn, đồng thời giảm rủi ro giao dịch bằng cách tích hợp nhiều công cụ phân tích kỹ thuật.
Cốt lõi của chiến lược này bao gồm hai phần chính: Bollinger Bands và chỉ số SuperTrend.
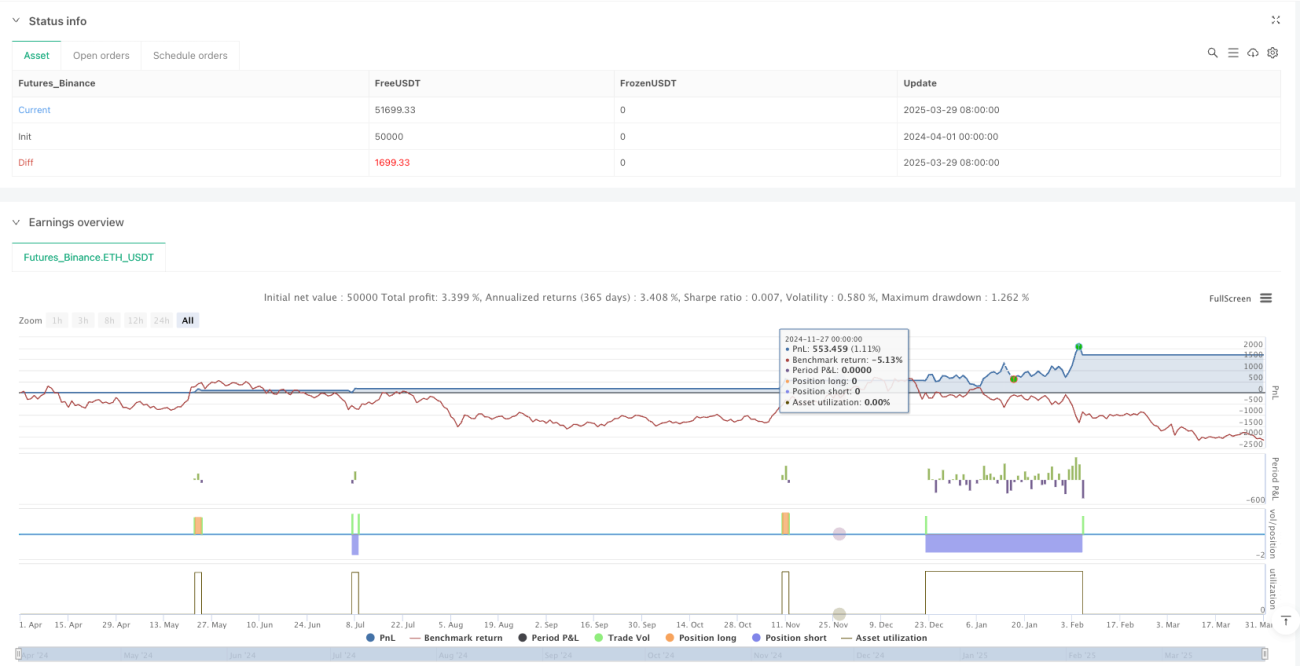
Đây là một chiến lược giao dịch kết hợp nhiều chỉ số năng động, cung cấp một hệ thống tín hiệu giao dịch tương đối toàn diện thông qua sự kết hợp của Brin Belt và Super Trend. Cốt lõi của chiến lược là cân bằng chính xác tín hiệu và quản lý rủi ro, nhưng vẫn cần phải được tối ưu hóa và điều chỉnh liên tục cho các môi trường thị trường khác nhau.
/*backtest
start: 2024-04-01 00:00:00
end: 2025-03-31 00:00:00
period: 2d
basePeriod: 2d
exchanges: [{"eid":"Futures_Binance","currency":"ETH_USDT"}]
*/
//@version=6
strategy("Combined BB & New SuperTrend Strategy", overlay=true, initial_capital=100000, default_qty_type=strategy.percent_of_equity, default_qty_value=10, pyramiding=0)
//============================
// Bollinger Bands Parameters
//============================
lengthBB = input.int(20, minval=1, title="BB Length")
maType = input.string("SMA", "BB Basis MA Type", options=["SMA", "EMA", "SMMA (RMA)", "WMA", "VWMA"])
srcBB = input(close, title="BB Source")
multBB = input.float(2.0, minval=0.001, maxval=50, title="BB StdDev Multiplier")
offsetBB = input.int(0, title="BB Offset", minval=-500, maxval=500)
// Moving average function based on chosen type
ma(source, length, _type) =>
switch _type
"SMA" => ta.sma(source, length)
"EMA" => ta.ema(source, length)
"SMMA (RMA)" => ta.rma(source, length)
"WMA" => ta.wma(source, length)
"VWMA" => ta.vwma(source, length)
// Bollinger Bands calculations
basis = ma(srcBB, lengthBB, maType)
dev = multBB * ta.stdev(srcBB, lengthBB)
upperBB = basis + dev
lowerBB = basis - dev
// Plot Bollinger Bands
plot(basis, title="BB Basis", color=color.blue, offset=offsetBB)
p1 = plot(upperBB, title="BB Upper", color=color.red, offset=offsetBB)
p2 = plot(lowerBB, title="BB Lower", color=color.green, offset=offsetBB)
fill(p1, p2, title="BB Fill", color=color.new(color.blue, 90))
//============================
// New SuperTrend Parameters & Calculations
// (Based on the new script you provided)
//============================
st_length = input.int(title="ATR Period", defval=22)
st_mult = input.float(title="ATR Multiplier", step=0.1, defval=3)
st_src = input.source(title="SuperTrend Source", defval=hl2)
st_wicks = input.bool(title="Take Wicks into Account?", defval=true)
st_showLabels = input.bool(title="Show Buy/Sell Labels?", defval=true)
st_highlightState = input.bool(title="Highlight State?", defval=true)
// Calculate ATR component for SuperTrend
st_atr = st_mult * ta.atr(st_length)
// Price selection based on wicks option
st_highPrice = st_wicks ? high : close
st_lowPrice = st_wicks ? low : close
st_doji4price = (open == close and open == low and open == high)
// Calculate SuperTrend stop levels
st_longStop = st_src - st_atr
st_longStopPrev = nz(st_longStop[1], st_longStop)
if st_longStop > 0
if st_doji4price
st_longStop := st_longStopPrev
else
st_longStop := (st_lowPrice[1] > st_longStopPrev ? math.max(st_longStop, st_longStopPrev) : st_longStop)
else
st_longStop := st_longStopPrev
st_shortStop = st_src + st_atr
st_shortStopPrev = nz(st_shortStop[1], st_shortStop)
if st_shortStop > 0
if st_doji4price
st_shortStop := st_shortStopPrev
else
st_shortStop := (st_highPrice[1] < st_shortStopPrev ? math.min(st_shortStop, st_shortStopPrev) : st_shortStop)
else
st_shortStop := st_shortStopPrev
// Determine trend direction: 1 for bullish, -1 for bearish
var int st_dir = 1
st_dir := st_dir == -1 and st_highPrice > st_shortStopPrev ? 1 : st_dir == 1 and st_lowPrice < st_longStopPrev ? -1 : st_dir
// Define colors for SuperTrend
st_longColor = color.green
st_shortColor = color.red
// Plot SuperTrend stops
st_longStopPlot = plot(st_dir == 1 ? st_longStop : na, title="Long Stop", style=plot.style_line, linewidth=2, color=st_longColor)
st_shortStopPlot = plot(st_dir == -1 ? st_shortStop : na, title="Short Stop", style=plot.style_line, linewidth=2, color=st_shortColor)
// Generate SuperTrend signals based on direction change
st_buySignal = st_dir == 1 and st_dir[1] == -1
st_sellSignal = st_dir == -1 and st_dir[1] == 1
// Optionally plot labels for buy/sell signals
if st_buySignal and st_showLabels
label.new(bar_index, st_longStop, "Buy", style=label.style_label_up, color=st_longColor, textcolor=color.white, size=size.tiny)
if st_sellSignal and st_showLabels
label.new(bar_index, st_shortStop, "Sell", style=label.style_label_down, color=st_shortColor, textcolor=color.white, size=size.tiny)
// Fill the state area (optional visual enhancement)
st_midPricePlot = plot(ohlc4, title="", style=plot.style_circles, linewidth=1, display=display.none)
st_longFillColor = st_highlightState ? (st_dir == 1 ? st_longColor : na) : na
st_shortFillColor = st_highlightState ? (st_dir == -1 ? st_shortColor : na) : na
fill(st_midPricePlot, st_longStopPlot, title="Long State Filling", color=st_longFillColor)
fill(st_midPricePlot, st_shortStopPlot, title="Short State Filling", color=st_shortFillColor)
//============================
// Trading Logic
//============================
// When a bullish reversal occurs, close any short position before entering long.
if st_buySignal
strategy.close("Short")
strategy.entry("Long", strategy.long)
// When a bearish reversal occurs, close any long position before entering short.
if st_sellSignal
strategy.close("Long")
strategy.entry("Short", strategy.short)
// Exit conditions using Bollinger Bands:
// - For a long position: exit if price reaches (or exceeds) the upper Bollinger Band.
// - For a short position: exit if price reaches (or falls below) the lower Bollinger Band.
if strategy.position_size > 0 and close >= upperBB
strategy.close("Long", comment="Exit Long via BB Upper")
if strategy.position_size < 0 and close <= lowerBB
strategy.close("Short", comment="Exit Short via BB Lower")