
[trans]
Tổng quan
Chiến lược giao dịch đa điểm trục kết hợp hệ thống chỉ báo Fibonacci động là một chiến lược giao dịch dựa trên phân tích kỹ thuật, chủ yếu sử dụng các điểm trục trong ngày, vùng trung tâm (CPR), các mức thoái lui Fibonacci, giá trị trung bình gia quyền khối lượng (VWAP) và đường trung bình động để xác định các cơ hội mua và bán tiềm năng. Chiến lược này phù hợp cho các nhà giao dịch trong ngày, đặc biệt là giao dịch ngắn hạn trên khung thời gian nến 3 phút. Cốt lõi của chiến lược là xác định xem nến đáp ứng các điều kiện cụ thể có chạm vào các mức hỗ trợ và kháng cự chính hay không, từ đó kích hoạt tín hiệu giao dịch.
Chiến lược sử dụng hệ thống điểm trục được tính toán dựa trên giá cao nhất, thấp nhất và giá đóng cửa hàng ngày, kết hợp với giá trị trung bình gia quyền khối lượng (VWAP) và VWAP di động (MVWAP) làm tham chiếu hỗ trợ/kháng cự động. Đồng thời, thông qua các chỉ báo kỹ thuật như chỉ số sức mạnh tương đối (RSI), đường trung bình động đơn giản (SMA) và đường trung bình động hàm mũ (EMA), một hệ thống ra quyết định giao dịch toàn diện được xây dựng.
Đầu tiên, chiến lược xác định các nến xanh (tăng) và đỏ (giảm) đáp ứng điều kiện, sau đó xác định xem các nến này có chạm vào các mức giá chính như điểm trục, hỗ trợ, kháng cự hoặc VWAP hay không. Khi nến đỏ chạm mức giá chính, tín hiệu mua (CE) được kích hoạt; khi nến xanh chạm mức giá chính, tín hiệu bán (PE) được kích hoạt. Tư duy đảo chiều này thể hiện ý tưởng cốt lõi là tìm kiếm các điểm đảo chiều tiềm năng tại các mức giá chính.
Nguyên lý chiến lược
Nguyên lý của chiến lược này dựa trên hành vi thị trường biến động xung quanh các mức hỗ trợ và kháng cự chính, kết hợp với mô hình nến, khối lượng và chỉ báo động lượng để đưa ra quyết định giao dịch. Phân tích nguyên lý cụ thể như sau:
-
Cơ chế nhận dạng nến:
- Nến xanh (tăng): Giá đóng cửa cao hơn giá mở cửa, thân nến ít nhất 17 điểm, giá mở cửa thấp hơn giá thấp cộng 0,382 lần biên độ nến, giá đóng cửa cao hơn giá thấp cộng 0,682 lần biên độ nến.
- Nến đỏ (giảm): Giá đóng cửa thấp hơn giá mở cửa, thân nến ít nhất 17 điểm.
-
Hệ thống tính toán điểm trục:
- Điểm trục ngày (PP): (Giá cao ngày + Giá thấp ngày + Giá đóng cửa ngày) / 3
- Mức kháng cự: R1, R2, R3, R4
- Mức hỗ trợ: S1, S2, S3, S4
- Vùng trung tâm (CPR): Bao gồm CPR dưới và CPR trên, cung cấp vùng giá mà thị trường có thể tích lũy
-
Tham chiếu giá động:
- VWAP (Giá trị trung bình gia quyền khối lượng): Phản ánh mức giá trung bình có tính đến yếu tố khối lượng
- MVWAP (Giá trị trung bình gia quyền khối lượng di động): Đường trung bình động của VWAP, cung cấp tham chiếu giá mượt mà hơn
-
Hệ thống chỉ báo phụ trợ:
- RSI: Đo lường tình trạng quá mua/quá bán của thị trường
- SMA (chu kỳ 50) và EMA (chu kỳ 20): Cung cấp tham chiếu hướng xu hướng giá
- Phân tích khối lượng: Đánh giá xu hướng khối lượng thông qua đường trung bình khối lượng chu kỳ 20
-
Tạo tín hiệu giao dịch:
- Khi nến đỏ đáp ứng điều kiện chạm vào bất kỳ điểm trục, hỗ trợ, kháng cự hoặc VWAP/MVWAP nào, tín hiệu mua (CE) được tạo ra
- Khi nến xanh đáp ứng điều kiện chạm vào bất kỳ điểm trục, hỗ trợ, kháng cự hoặc VWAP/MVWAP nào, tín hiệu bán (PE) được tạo ra
Ý tưởng cốt lõi của chiến lược là nắm bắt sự đảo chiều tiềm năng của giá gần các mức hỗ trợ/kháng cự chính, thông qua việc lọc các mô hình nến cụ thể và nhiều chỉ báo kỹ thuật để nâng cao hiệu quả của tín hiệu. Nến chạm điểm trục thường cho thấy khả năng thị trường do dự hoặc đảo chiều tại các mức giá chính này tăng lên.
Ưu điểm chiến lược
Phân tích sâu mã chiến lược, chúng ta có thể tóm tắt những ưu điểm nổi bật sau:
-
Cơ chế xác minh đa chiều: Kết hợp nhiều chỉ báo kỹ thuật (điểm trục, VWAP, đường trung bình động, RSI) để xác minh tín hiệu giao dịch, giảm rủi ro tín hiệu giả.
-
Thích ứng động với thị trường: Hệ thống điểm trục trong ngày được cập nhật hàng ngày, cho phép chiến lược thích ứng với các môi trường thị trường và biến động khác nhau.
-
Nhận dạng nến chính xác: Thông qua các điều kiện mô hình nến nghiêm ngặt và mức Fibonacci để sàng lọc các cơ hội giao dịch tiềm năng, nâng cao chất lượng tín hiệu.
-
Cài đặt hiển thị linh hoạt: Chiến lược có chức năng thích ứng với khung nhìn, chỉ hiển thị điểm trục trong khung thời gian phù hợp (biểu đồ trong ngày dưới 15 phút), giảm sự lộn xộn trên biểu đồ.
-
Lợi thế tư duy ngược: Chiến lược tìm kiếm cơ hội mua khi nến đỏ chạm vị trí chính và cơ hội bán khi nến xanh chạm vị trí chính, tận dụng tình trạng quá mua/quá bán ngắn hạn tiềm năng của thị trường.
-
Hệ thống phân cấp giá hoàn chỉnh: Bao gồm nhiều lớp hỗ trợ/kháng cự (S1-S4 và R1-R4), cung cấp nhiều mức giá tham khảo, phù hợp với các môi trường thị trường có biên độ biến động khác nhau.
-
Tích hợp vùng trung tâm (CPR): CPR cung cấp khả năng nhận dạng vùng tích lũy tiềm năng trong ngày, có giá trị tham khảo quan trọng trong giao dịch trong ngày.
-
Hỗ trợ trực quan: Thông qua các đánh dấu và hình dạng phong phú, hiển thị trực quan trên biểu đồ các nến đáp ứng điều kiện và trường hợp chạm vào giá chính, giúp nhà giao dịch nhận biết nhanh chóng.
-
Xác nhận khối lượng: Kết hợp phân tích khối lượng, đánh giá mức độ tham gia thị trường thông qua đường trung bình khối lượng, tăng cường độ tin cậy của tín hiệu.
-
Phù hợp giao dịch trong ngày: Chiến lược được thiết kế riêng cho khung thời gian ngắn (đặc biệt là biểu đồ 3 phút), phù hợp cho các nhà giao dịch trong ngày tận dụng biến động thị trường để giao dịch thường xuyên.
Những ưu điểm trên làm cho chiến lược này trở thành một hệ thống giao dịch trong ngày toàn diện, thích ứng tốt, đặc biệt phù hợp với các nhà đầu tư có hiểu biết nhất định về phân tích kỹ thuật và muốn giao dịch dựa trên hành vi giá và các mức giá chính.
Rủi ro chiến lược
Mặc dù chiến lược có nhiều ưu điểm, nhưng cũng tồn tại một số rủi ro tiềm ẩn mà nhà giao dịch cần thận trọng đối phó:
-
Rủi ro quá nhiều tín hiệu: Do chiến lược liên quan đến nhiều điểm trục (PP, R1-R4, S1-S4) và các chỉ báo khác, có thể tạo ra quá nhiều tín hiệu trong thị trường biến động mạnh, dẫn đến giao dịch thường xuyên và tăng phí.
- Cách khắc phục: Có thể xem xét thêm các bộ lọc bổ sung, chẳng hạn như giới hạn phiên giao dịch hoặc điều kiện xác nhận xu hướng.
-
Bẫy giao dịch ngược: Chiến lược dựa trên logic ngược (nến đỏ chạm vị trí chính thì mua, nến xanh chạm vị trí chính thì bán), có thể dẫn đến thua lỗ liên tiếp trong thị trường có xu hướng mạnh.
- Cách khắc phục: Đánh giá xu hướng thị trường tổng thể trước khi sử dụng chiến lược, có thể thêm bộ lọc xu hướng để tránh giao dịch ngược xu hướng trong xu hướng mạnh.
-
Độ nhạy tham số: Hiệu quả của chiến lược phụ thuộc nhiều vào các tham số nhận dạng nến (ví dụ: chiều cao nến phải lớn hơn 17 điểm) và cài đặt chu kỳ đường trung bình động, các môi trường thị trường khác nhau có thể yêu cầu tham số khác nhau.
- Cách khắc phục: Backtest trên các sản phẩm và điều kiện thị trường khác nhau, tối ưu hóa cài đặt tham số.
-
Thiếu cơ chế dừng lỗ: Mã không thiết lập rõ ràng chiến lược dừng lỗ, có thể dẫn đến thua lỗ quá lớn cho mỗi giao dịch.
- Cách khắc phục: Thực hiện chiến lược dừng lỗ rõ ràng, chẳng hạn như dừng lỗ động dựa trên ATR hoặc dừng lỗ cố định điểm.
-
Hạn chế của chiến lược trong ngày: Là chiến lược trong ngày tập trung vào biểu đồ 3 phút, không phù hợp với nắm giữ trung và dài hạn, bỏ lỡ các cơ hội xu hướng dài hạn tiềm năng.
- Cách khắc phục: Coi chiến lược này là một phần của hệ thống giao dịch, kết hợp với các chiến lược trung và dài hạn.
-
Hạn chế của điểm trục: Trong thị trường đi ngang, giá có thể thường xuyên chạm vào nhiều điểm trục, tạo ra tín hiệu hỗn loạn.
- Cách khắc phục: Trong thị trường tích lũy, có thể xem xét tạm thời tắt chiến lược hoặc thêm điều kiện xác nhận tín hiệu.
-
Thiếu điều chỉnh trọng số khối lượng: Mặc dù sử dụng VWAP, nhưng chiến lược không điều chỉnh động trọng số tín hiệu dựa trên khối lượng.
- Cách khắc phục: Có thể thêm điều kiện ngưỡng khối lượng, đảm bảo giao dịch khi có mức độ tham gia thị trường đủ lớn.
-
Phụ thuộc vào thời gian: Điểm trục ngày dựa trên dữ liệu ngày trước đó, khi bắt đầu phiên giao dịch mới có thể hoạt động không ổn định do thiếu dữ liệu đầy đủ trong ngày.
- Cách khắc phục: Cân nhắc kích hoạt chiến lược sau 30-60 phút đầu phiên giao dịch để có đủ thông tin thị trường.
-
Thách thức thực hiện tự động: Chiến lược liên quan đến nhiều điều kiện phán đoán, khi thực hiện tự động thực tế có thể gặp phải vấn đề chậm trễ hoặc không thực hiện kịp thời.
- Cách khắc phục: Tối ưu hóa hệ thống thực hiện, đảm bảo độ trễ thấp, hoặc xem xét phương thức bán tự động kết hợp với xác nhận thủ công.
-
Rủi ro sai lệch backtest: Logic nhận dạng nến xanh/đỏ trong mã có thể hoạt động không nhất quán giữa môi trường backtest và giao dịch thực.
- Cách khắc phục: Tiến hành kiểm tra mô phỏng thực tế nghiêm ngặt để đảm bảo chiến lược vẫn hiệu quả trong môi trường giao dịch thực.
Nhận biết và quản lý các rủi ro này là rất quan trọng để áp dụng thành công chiến lược, nhà giao dịch nên điều chỉnh phù hợp dựa trên khả năng chịu rủi ro và thói quen giao dịch của bản thân.
Hướng tối ưu hóa chiến lược
Dựa trên phân tích chuyên sâu mã, đây là các hướng chính có thể tối ưu hóa chiến lược:
-
Tham số nhận dạng nến động:
- Chiến lược hiện tại sử dụng giá trị cố định (ví dụ: chiều cao nến ít nhất 17 điểm) để nhận dạng nến hiệu quả, có thể thay đổi thành tham số động dựa trên ATR (Dải biến động trung bình thực) để chiến lược thích ứng tốt hơn với các môi trường biến động khác nhau.
- Lý do tối ưu: Tham số cố định có hiệu quả khác nhau trong các môi trường biến động khác nhau, tham số động có thể cải thiện khả năng thích ứng của chiến lược.
-
Hệ thống lọc xu hướng:
- Thêm phán đoán xu hướng trên khung thời gian cao hơn (ví dụ: 15 phút hoặc 30 phút), chỉ thực hiện giao dịch theo hướng xu hướng chính hoặc điều chỉnh trọng số tín hiệu.
- Lý do tối ưu: Tránh giao dịch ngược xu hướng thường xuyên trong xu hướng mạnh, cải thiện tỷ lệ thắng và tỷ lệ lợi nhuận/rủi ro.
-
Cơ chế chấm điểm chất lượng tín hiệu:
- Thiết lập hệ thống chấm điểm tổng hợp cho mỗi tín hiệu giao dịch, xem xét nhiều yếu tố như: cường độ nến, tầm quan trọng của điểm trục chạm, giá trị RSI, khối lượng bất thường, v.v.
- Lý do tối ưu: Không phải tất cả các tín hiệu đều có chất lượng như nhau, hệ thống chấm điểm có thể lọc các tín hiệu chất lượng thấp, cải thiện hiệu quả giao dịch.
-
Tích hợp quản lý vốn:
- Điều chỉnh động kích thước vị thế dựa trên cường độ tín hiệu và điều kiện thị trường, tăng vị thế trong cơ hội xác suất cao, giảm mức rủi ro trong trường hợp xác suất thấp.
- Lý do tối ưu: Quản lý vốn hiệu quả rất quan trọng đối với lợi nhuận dài hạn, có thể cải thiện đáng kể hiệu suất chiến lược.
-
Xác nhận đa khung thời gian:
- Kiểm tra tính nhất quán của điều kiện trên nhiều khung thời gian trước khi tạo tín hiệu, ví dụ: giao dịch khi tín hiệu trên biểu đồ 3 phút và 15 phút đồng nhất.
- Lý do tối ưu: Xác nhận đa khung thời gian có thể giảm xác suất tín hiệu sai, cải thiện độ chính xác giao dịch.
-
Cơ chế dừng lỗ và chốt lời:
- Thực hiện hệ thống dừng lỗ thông minh, chẳng hạn như dừng lỗ động dựa trên biến động hoặc dừng lỗ tại các vị trí cấu trúc chính, đồng thời thiết lập mục tiêu chốt lời tự động.
- Lý do tối ưu: Quản lý rủi ro hoàn chỉnh rất quan trọng để tránh sụt giảm lớn và bảo vệ lợi nhuận.
-
Lọc thời gian giao dịch:
- Xác định các phiên giao dịch hiệu quả và kém hiệu quả, tránh các khoảng thời gian thị trường biến động thấp hoặc hỗn loạn (ví dụ: giờ nghỉ trưa hoặc trước và sau khi mở/đóng cửa thị trường).
- Lý do tối ưu: Hành vi thị trường khác nhau trong các khoảng thời gian khác nhau, giao dịch có chọn lọc có thể cải thiện hiệu quả tổng thể.
-
Tham số chỉ báo thích ứng:
- Thay đổi các tham số chỉ báo kỹ thuật cố định (ví dụ: chu kỳ 14 của RSI, chu kỳ 20 của EMA) thành các tham số tự động điều chỉnh dựa trên trạng thái thị trường.
- Lý do tối ưu: Khi điều kiện thị trường thay đổi, các tham số chỉ báo tối ưu cũng cần được điều chỉnh tương ứng, cải thiện độ nhạy của chỉ báo.
-
Phân loại môi trường thị trường:
- Thêm thuật toán tự động nhận dạng môi trường thị trường hiện tại (xu hướng, đi ngang, biến động cao, v.v.) và áp dụng các cài đặt tham số khác nhau cho các môi trường khác nhau.
- Lý do tối ưu: Một thiết lập tham số duy nhất khó có thể hoạt động tốt nhất trong tất cả các môi trường thị trường, điều chỉnh thích ứng với môi trường có thể cải thiện đáng kể tính ổn định của chiến lược.
-
Tăng cường Học máy:
- Cân nhắc tích hợp mô hình học máy để dự đoán xác suất thành công của tín hiệu, dựa trên nhận dạng mẫu hình lịch sử nhằm sàng lọc và ưu tiên các tín hiệu giao dịch.
- Lý do tối ưu hóa: Học máy có thể phát hiện các mẫu hình phức tạp mà con người khó nhận ra, nâng cao trình độ thông minh hóa của chiến lược.
Bằng cách thực hiện các hướng tối ưu hóa trên, chiến lược này có thể cải thiện đáng kể khả năng thích ứng, độ chính xác và khả năng sinh lời dài hạn dựa trên việc giữ nguyên các ưu điểm vốn có, đối phó tốt hơn với các thách thức của các điều kiện thị trường khác nhau.
Tổng kết
Hệ thống Chỉ báo Fibonacci Động & Chiến lược Giao dịch Điểm Xoay Đa chiều là một hệ thống chiến lược giao dịch trong ngày có tính toàn diện và cấu trúc hoàn chỉnh. Nó kết hợp khéo léo các công cụ phân tích kỹ thuật truyền thống (Điểm xoay, Fibonacci Retracement, Đường trung bình động) với các chỉ báo động hiện đại (VWAP, CPR), thông qua việc sàng lọc điều kiện nến nghiêm ngặt và xác nhận đa chỉ báo, cung cấp cho nhà giao dịch một khuôn khổ giao dịch trong ngày tiềm năng.
Ưu điểm cốt lõi của chiến lược này nằm ở việc bao phủ toàn diện các mức giá quan trọng và khả năng nắm bắt nhạy bén các điểm đảo chiều tiềm năng. Bằng cách thiết lập các điều kiện nhận dạng nến nghiêm ngặt, chiến lược có thể lọc bỏ lượng lớn nhiễu thị trường vô nghĩa, tập trung vào các cơ hội giao dịch có xác suất cao. Đồng thời, việc kết hợp sử dụng các chỉ báo khối lượng và động lượng càng làm tăng thêm độ tin cậy của tín hiệu.
Tuy nhiên, chiến lược cũng có một số hạn chế, chẳng hạn như tín hiệu có thể quá nhiều, rủi ro giao dịch ngược chiều và thách thức tối ưu hóa tham số. Để giải quyết những vấn đề này, chúng tôi đã đề xuất nhiều hướng tối ưu hóa, bao gồm điều chỉnh tham số động, xác nhận khung thời gian đa dạng, quản lý vốn thông minh và thích ứng với môi trường thị trường, v.v. Những tối ưu hóa này có thể giúp nhà giao dịch điều chỉnh chiến lược theo nhu cầu riêng và đặc điểm thị trường, nâng cao hiệu quả giao dịch tổng thể.
Đáng chú ý là, không có bất kỳ chiến lược giao dịch nào là công cụ "biến đá thành vàng". Thành công trong giao dịch, ngoài việc phụ thuộc vào bản thân chiến lược, còn cần đến sự kiên nhẫn, kỷ luật và việc học hỏi liên tục của nhà giao dịch. Đối với chiến lược này, khuyến nghị các nhà giao dịch trước tiên hãy thử nghiệm đầy đủ trong môi trường mô phỏng, làm quen với các đặc điểm hoạt động của nó trong các điều kiện thị trường khác nhau, từ từ điều chỉnh các tham số để phù hợp với các sản phẩm giao dịch và phong cách cá nhân cụ thể, cuối cùng hình thành một hệ thống giao dịch được cá nhân hóa và có khả năng sinh lời bền vững.
Thông qua thực hành, phản hồi và tối ưu hóa liên tục, Hệ thống Chỉ báo Fibonacci Động & Chiến lược Giao dịch Điểm Xoay Đa chiều có thể trở thành một vũ khí lợi hại trong bộ công cụ của nhà giao dịch trong ngày, cung cấp một khuôn khổ phân tích kỹ thuật đáng tin cậy để nắm bắt các biến động thị trường trong ngày.
- Tạo Tín Hiệu Giao Dịch:
- Khi các nến đỏ đủ điều kiện chạm vào bất kỳ điểm xoay (pivot point), mức hỗ trợ, mức kháng cự, hoặc VWAP/MVWAP, tín hiệu mua (CE) được tạo ra
- Khi các nến xanh đủ điều kiện chạm vào bất kỳ điểm xoay, mức hỗ trợ, mức kháng cự, hoặc VWAP/MVWAP, tín hiệu bán (PE) được tạo ra
Ý tưởng cốt lõi của chiến lược là nắm bắt các đảo chiều tiềm năng gần các mức hỗ trợ và kháng cự chính, được lọc qua các mẫu nến cụ thể và nhiều chỉ báo kỹ thuật để tăng cường độ tin cậy của tín hiệu. Các nến chạm điểm xoay thường thể hiện khả năng gia tăng về sự do dự hoặc đảo chiều của thị trường tại các mức giá quan trọng này.
Ưu Điểm Chiến Lược
Phân tích sâu mã chiến lược cho thấy những ưu điểm đáng kể sau:
-
Cơ Chế Xác Minh Đa Chiều: Kết hợp nhiều chỉ báo kỹ thuật (điểm xoay, VWAP, đường trung bình động, RSI) để xác thực tín hiệu giao dịch, giảm thiểu rủi ro tín hiệu sai.
-
Thích Ứng Thị Trường Động: Hệ thống điểm xoay hàng ngày được cập nhật mỗi ngày, cho phép chiến lược thích ứng với các môi trường thị trường và mức biến động khác nhau.
-
Nhận Dạng Nến Chính Xác: Sàng lọc các cơ hội giao dịch tiềm năng thông qua các điều kiện mẫu nến nghiêm ngặt và các mức Fibonacci, nâng cao chất lượng tín hiệu.
-
Cài Đặt Hiển Thị Linh Hoạt: Chiến lược có chức năng thích ứng khung nhìn, chỉ hiển thị điểm xoay trong các khung thời gian phù hợp (biểu đồ trong ngày dưới 15 phút), giảm sự lộn xộn trên biểu đồ.
-
Lợi Thế Tư Duy Ngược Chiều: Chiến lược tìm kiếm cơ hội mua khi nến đỏ chạm các mức chính và cơ hội bán khi nến xanh chạm các mức chính, tận dụng các điều kiện quá mua/quá bán ngắn hạn tiềm năng của thị trường.
-
Phân Cấp Mức Giá Đầy Đủ: Bao gồm nhiều lớp hỗ trợ và kháng cự (S1-S4 và R1-R4), cung cấp các mức giá tham khảo phong phú, phù hợp với các môi trường thị trường có phạm vi biến động khác nhau.
-
Tích Hợp Phạm Vi Trục Trung Tâm (CPR): CPR cung cấp khả năng nhận dạng các vùng tích lũy tiềm năng trong ngày, có giá trị tham khảo quan trọng trong giao dịch nội ngày.
-
Hỗ Trợ Trực Quan: Thông qua các marker và hình dạng phong phú, các nến đủ điều kiện và các trường hợp chạm mức giá chính được đánh dấu trực quan trên biểu đồ, cho phép nhà giao dịch nhanh chóng nhận diện.
-
Xác Nhận Khối Lượng: Kết hợp phân tích khối lượng, đánh giá mức độ tham gia thị trường thông qua đường trung bình động khối lượng, tăng cường độ tin cậy của tín hiệu.
-
Phù Hợp Giao Dịch Trong Ngày: Chiến lược được thiết kế đặc biệt cho các khung thời gian ngắn (đặc biệt là biểu đồ 3 phút), phù hợp với các nhà giao dịch trong ngày muốn tận dụng biến động thị trường thông qua giao dịch thường xuyên.
Những ưu điểm này làm cho chiến lược này trở thành một hệ thống giao dịch nội ngày mạnh mẽ, có khả năng thích ứng, đặc biệt phù hợp với các nhà đầu tư có hiểu biết tốt về phân tích kỹ thuật và muốn giao dịch dựa trên hành động giá và các mức giá chính.
Rủi Ro Chiến Lược
Mặc dù có nhiều ưu điểm, chiến lược cũng tiềm ẩn một số rủi ro mà nhà giao dịch cần cân nhắc cẩn thận:
-
Rủi Ro Tín Hiệu Quá Mức: Do chiến lược liên quan đến nhiều điểm xoay (PP, R1-R4, S1-S4) và các chỉ báo khác, nó có thể tạo ra quá nhiều tín hiệu trong thị trường biến động, dẫn đến giao dịch thường xuyên và tăng phí.
- Giải pháp: Cân nhắc thêm các điều kiện lọc bổ sung, chẳng hạn như giới hạn phiên giao dịch hoặc điều kiện xác nhận xu hướng.
-
Bẫy Giao Dịch Ngược Chiều: Chiến lược dựa trên logic ngược chiều (mua khi nến đỏ chạm mức chính, bán khi nến xanh chạm mức chính), điều này có thể dẫn đến thua lỗ liên tiếp trong thị trường có xu hướng mạnh.
- Giải pháp: Đánh giá xu hướng thị trường tổng thể trước khi sử dụng chiến lược và thêm bộ lọc xu hướng để tránh giao dịch ngược xu hướng trong các xu hướng mạnh.
-
Độ nhạy tham số: Hiệu quả chiến lược phụ thuộc nhiều vào các tham số nhận dạng nến (ví dụ: chiều cao nến phải vượt quá 17 điểm) và cài đặt chu kỳ đường trung bình động, có thể yêu cầu các tham số khác nhau trong các môi trường thị trường khác nhau.
- Giải pháp: Backtest các công cụ và điều kiện thị trường khác nhau để tối ưu hóa cài đặt tham số.
-
Thiếu cơ chế cắt lỗ: Không có chiến lược cắt lỗ rõ ràng được thiết lập trong code, có thể dẫn đến thua lỗ quá mức cho một giao dịch duy nhất.
- Giải pháp: Triển khai các chiến lược cắt lỗ rõ ràng, chẳng hạn như cắt lỗ động dựa trên ATR hoặc cắt lỗ cố định điểm.
-
Hạn chế của chiến lược trong ngày: Là chiến lược tập trung vào biểu đồ 3 phút, không phù hợp để nắm giữ trung và dài hạn, có thể bỏ lỡ cơ hội trong các xu hướng dài hạn hơn.
- Giải pháp: Xem chiến lược này như một phần của hệ thống giao dịch, sử dụng kết hợp với các chiến lược trung và dài hạn.
-
Hạn chế của điểm xoay: Trong thị trường đi ngang, giá có thể chạm nhiều điểm xoay thường xuyên, tạo ra các tín hiệu gây nhầm lẫn.
- Giải pháp: Cân nhắc tạm thời vô hiệu hóa chiến lược hoặc thêm điều kiện xác nhận tín hiệu trong thị trường tích lũy.
-
Thiếu điều chỉnh trọng số khối lượng: Mặc dù sử dụng VWAP, chiến lược không điều chỉnh trọng số tín hiệu một cách động dựa trên quy mô khối lượng.
- Giải pháp: Thêm điều kiện ngưỡng khối lượng để đảm bảo giao dịch diễn ra khi có đủ sự tham gia của thị trường.
-
Phụ thuộc thời gian: Điểm xoay hàng ngày dựa trên dữ liệu ngày hôm trước và có thể hoạt động không ổn định vào đầu ngày giao dịch mới do thiếu dữ liệu ngày hiện tại.
- Giải pháp: Cân nhắc kích hoạt chiến lược sau 30-60 phút kể từ khi bắt đầu ngày giao dịch để thu thập đủ thông tin thị trường.
-
Thách thức triển khai tự động hóa: Chiến lược liên quan đến nhiều điều kiện đánh giá, có thể gặp phải độ trễ hoặc thực thi không kịp thời trong quá trình thực thi tự động thực tế.
- Giải pháp: Tối ưu hóa hệ thống thực thi để đảm bảo độ trễ thấp, hoặc cân nhắc các phương pháp bán tự động kết hợp với xác nhận thủ công.
-
Rủi ro sai lệch backtest: Logic nhận dạng nến xanh/đỏ trong code có thể hoạt động không nhất quán giữa môi trường backtest và giao dịch thực tế.
- Giải pháp: Tiến hành kiểm tra mô phỏng thực tế nghiêm ngặt để đảm bảo chiến lược vẫn hiệu quả trong môi trường giao dịch thực tế.
Nhận biết và quản lý các rủi ro này là rất quan trọng để áp dụng thành công chiến lược này. Nhà giao dịch nên điều chỉnh phù hợp dựa trên khả năng chịu rủi ro và thói quen giao dịch của mình.
Hướng tối ưu hóa chiến lược
Dựa trên phân tích sâu về code, dưới đây là các hướng chính để tối ưu hóa chiến lược này:
-
Tham số nhận dạng nến động:
- Chiến lược hiện tại sử dụng các giá trị cố định (chẳng hạn như chiều cao nến ít nhất 17 điểm) để nhận dạng nến hiệu quả. Có thể thay đổi thành các tham số động dựa trên ATR (Khoảng dao động trung bình thực) để thích ứng tốt hơn với các môi trường biến động khác nhau.
- Lý do tối ưu hóa: Các tham số cố định hoạt động khác nhau trong các môi trường biến động khác nhau; tham số động có thể cải thiện khả năng thích ứng của chiến lược.
-
Hệ thống lọc xu hướng:
- Thêm xác định xu hướng từ khung thời gian cao hơn (chẳng hạn như 15 phút hoặc 30 phút) để chỉ thực hiện giao dịch theo hướng của xu hướng chính hoặc điều chỉnh trọng số tín hiệu.
- Lý do tối ưu hóa: Tránh giao dịch ngược xu hướng thường xuyên trong các xu hướng mạnh, cải thiện tỷ lệ thắng và tỷ lệ rủi ro/lợi nhuận.
-
Cơ chế chấm điểm chất lượng tín hiệu:
- Thiết lập một hệ thống chấm điểm toàn diện cho mỗi tín hiệu giao dịch, xem xét nhiều yếu tố như độ mạnh của nến, tầm quan trọng của điểm xoay được chạm, giá trị RSI, bất thường về khối lượng, v.v.
- Lý do tối ưu hóa: Không phải tất cả các tín hiệu đều có chất lượng như nhau; hệ thống chấm điểm có thể lọc ra các tín hiệu chất lượng thấp và nâng cao hiệu quả giao dịch.
-
Tích hợp quản lý vốn:
- Điều chỉnh linh hoạt kích thước vị thế dựa trên cường độ tín hiệu và điều kiện thị trường, tăng vị thế khi cơ hội có xác suất cao và giảm rủi ro trong tình huống xác suất thấp.
- Cơ sở tối ưu hóa: Quản lý vốn hiệu quả là yếu tố then chốt để đạt lợi nhuận dài hạn và có thể cải thiện đáng kể hiệu suất chiến lược.
-
Xác nhận đa khung thời gian:
- Kiểm tra tính nhất quán của điều kiện trên nhiều khung thời gian trước khi tạo tín hiệu, ví dụ chỉ giao dịch khi tín hiệu trên biểu đồ 3 phút và 15 phút khớp nhau.
- Cơ sở tối ưu hóa: Xác nhận đa khung thời gian có thể giảm xác suất tín hiệu nhiễu và nâng cao độ chính xác giao dịch.
-
Cơ chế dừng lỗ và chốt lời:
- Triển khai hệ thống dừng lỗ thông minh, như dừng lỗ động dựa trên biến động hoặc dừng lỗ tại các vị trí cấu trúc chính, đồng thời thiết lập mục tiêu chốt lời tự động.
- Cơ sở tối ưu hóa: Quản lý rủi ro hợp lý rất quan trọng để tránh sụt giảm lớn và bảo vệ lợi nhuận.
-
Bộ lọc thời gian giao dịch:
- Xác định các phiên giao dịch hiệu quả và kém hiệu quả, tránh các khoảng thời gian biến động thấp hoặc hỗn loạn (như giờ nghỉ trưa hoặc trước và sau khi thị trường mở cửa và đóng cửa).
- Cơ sở tối ưu hóa: Đặc điểm hành vi thị trường khác nhau ở các phiên giao dịch; giao dịch có chọn lọc có thể nâng cao hiệu quả tổng thể.
-
Tham số chỉ báo thích ứng:
- Thay đổi các tham số chỉ báo kỹ thuật cố định (như RSI 14 chu kỳ, EMA 20 chu kỳ) thành các tham số tự động điều chỉnh dựa trên trạng thái thị trường.
- Cơ sở tối ưu hóa: Khi điều kiện thị trường thay đổi, các tham số chỉ báo tối ưu cũng cần điều chỉnh tương ứng, cải thiện độ nhạy của chỉ báo.
-
Phân loại môi trường thị trường:
- Thêm thuật toán tự động xác định môi trường thị trường hiện tại (xu hướng, đi ngang, biến động cao, v.v.) và áp dụng các thiết lập tham số khác nhau cho từng môi trường.
- Cơ sở tối ưu hóa: Các thiết lập tham số đơn lẻ khó có thể hoạt động tối ưu trong mọi môi trường thị trường; điều chỉnh thích ứng với môi trường có thể nâng cao đáng kể độ ổn định của chiến lược.
-
Cải thiện bằng học máy:
- Xem xét tích hợp các mô hình học máy để dự đoán xác suất thành công của tín hiệu, lọc và ưu tiên các tín hiệu giao dịch dựa trên nhận dạng mẫu hình lịch sử.
- Cơ sở tối ưu hóa: Học máy có thể phát hiện các mẫu hình phức tạp khó nhận biết bằng con người, nâng cao mức độ thông minh của chiến lược.
Bằng cách triển khai các hướng tối ưu hóa này, chiến lược có thể cải thiện đáng kể khả năng thích ứng, độ chính xác và lợi nhuận dài hạn trong khi vẫn duy trì các lợi thế ban đầu, đối phó tốt hơn với các thách thức trong nhiều điều kiện thị trường khác nhau.
Tổng kết
Hệ thống Giao dịch Điểm Pivot Đa Chiều với Chỉ báo Fibonacci Động là một hệ thống chiến lược giao dịch trong ngày toàn diện, có cấu trúc tốt. Nó kết hợp một cách khéo léo các công cụ phân tích kỹ thuật truyền thống (điểm pivot, thoái lui Fibonacci, đường trung bình động) với các chỉ báo động hiện đại (VWAP, CPR). Thông qua việc sàng lọc điều kiện nến nghiêm ngặt và xác nhận đa chỉ báo, nó cung cấp cho nhà giao dịch một khuôn khổ giao dịch trong ngày đầy hứa hẹn.
Lợi thế cốt lõi của chiến lược này nằm ở khả năng bao phủ toàn diện các mức giá chính và phát hiện nhạy bén các điểm đảo chiều tiềm năng. Bằng cách thiết lập các điều kiện nhận dạng nến nghiêm ngặt, chiến lược có thể lọc ra một lượng lớn nhiễu thị trường vô nghĩa và tập trung vào các cơ hội giao dịch có xác suất cao. Đồng thời, việc sử dụng các chỉ báo khối lượng và động lượng giúp tăng cường thêm độ tin cậy của tín hiệu.
Tuy nhiên, chiến lược này cũng có một số hạn chế, chẳng hạn như tín hiệu có thể quá nhiều, rủi ro giao dịch ngược xu hướng và thách thức trong việc tối ưu hóa tham số. Để giải quyết những vấn đề này, chúng tôi đã đề xuất một số hướng tối ưu hóa, bao gồm điều chỉnh tham số động, xác nhận trên nhiều khung thời gian, quản lý vốn thông minh và thích ứng với môi trường thị trường. Những tối ưu hóa này có thể giúp nhà giao dịch điều chỉnh chiến lược theo nhu cầu riêng và đặc điểm thị trường, nâng cao hiệu quả giao dịch tổng thể.
Điều đáng chú ý là không có chiến lược giao dịch nào là "viên đạn bạc". Thành công trong giao dịch không chỉ phụ thuộc vào bản thân chiến lược mà còn vào sự kiên nhẫn, kỷ luật và việc học hỏi không ngừng của nhà giao dịch. Đối với chiến lược này, khuyến nghị nhà giao dịch trước tiên hãy thử nghiệm kỹ lưỡng trong môi trường mô phỏng, làm quen với các đặc tính hoạt động của nó trong các điều kiện thị trường khác nhau, từ từ điều chỉnh tham số để phù hợp với các công cụ giao dịch cụ thể và phong cách cá nhân, và cuối cùng hình thành một hệ thống giao dịch được cá nhân hóa, có lợi nhuận bền vững.
Thông qua thực hành liên tục, phản hồi và tối ưu hóa, Hệ thống giao dịch điểm xoay đa chiều với chỉ báo Fibonacci động có thể trở thành một vũ khí mạnh mẽ trong bộ công cụ của nhà giao dịch trong ngày, cung cấp một khuôn khổ phân tích kỹ thuật đáng tin cậy để nắm bắt các cơ hội thị trường ngắn hạn.
Sự tích hợp của chiến lược này giữa các điểm xoay truyền thống và các công cụ kỹ thuật hiện đại tạo ra một cách tiếp cận cân bằng, tôn trọng cấu trúc thị trường trong khi vẫn phản ứng nhanh với các biến động giá trong ngày. Bằng cách tập trung vào các tương tác giá chính tại các mức quan trọng, nhà giao dịch có thể phát triển sự hiểu biết sâu sắc hơn về tâm lý thị trường và có khả năng cải thiện hiệu suất giao dịch của mình.
Cuối cùng, để thực hiện thành công sẽ đòi hỏi sự tùy chỉnh chu đáo, kiểm tra nghiêm ngặt và thực hiện có kỷ luật. Khi được áp dụng đúng cách như một phần của kế hoạch giao dịch toàn diện bao gồm các nguyên tắc quản lý rủi ro hợp lý, chiến lược này cung cấp một phương pháp có hệ thống để điều hướng sự phức tạp của thị trường trong ngày với sự tự tin và chính xác cao hơn.
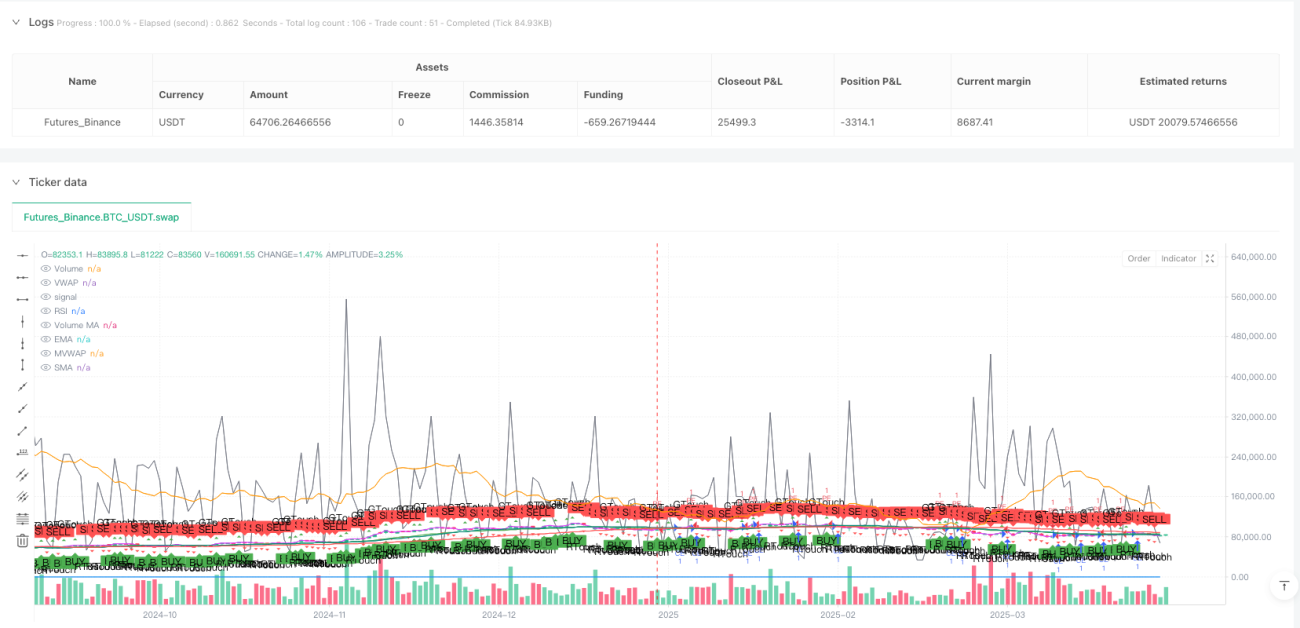
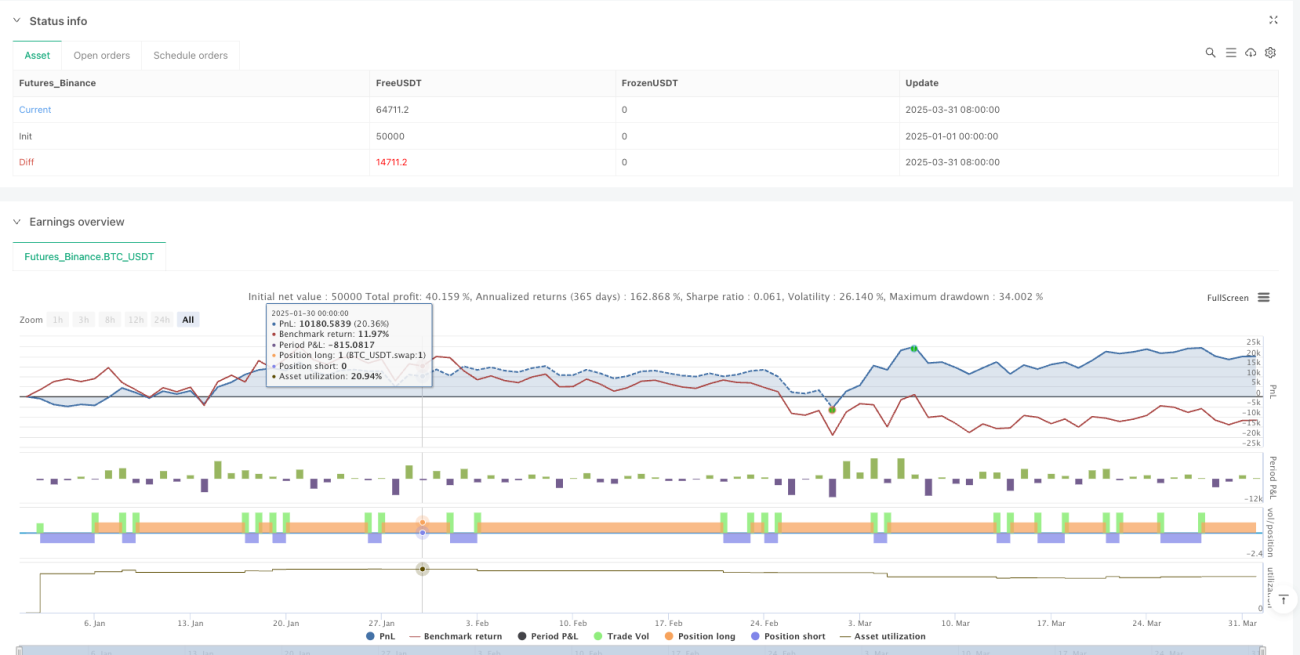
/*backtest
start: 2025-01-01 00:00:00
end: 2025-04-01 00:00:00
period: 1d
basePeriod: 1d
exchanges: [{"eid":"Futures_Binance","currency":"BTC_USDT"}]
*/

//@version=5
strategy("Pivot Point CE/PE Strategy", overlay=true)

// Identify 3-minute candles (Assuming the script is applied to a 3-minute chart)- 1