Chiến lược động lượng xu hướng giao thoa đa tham số

Tổng quan
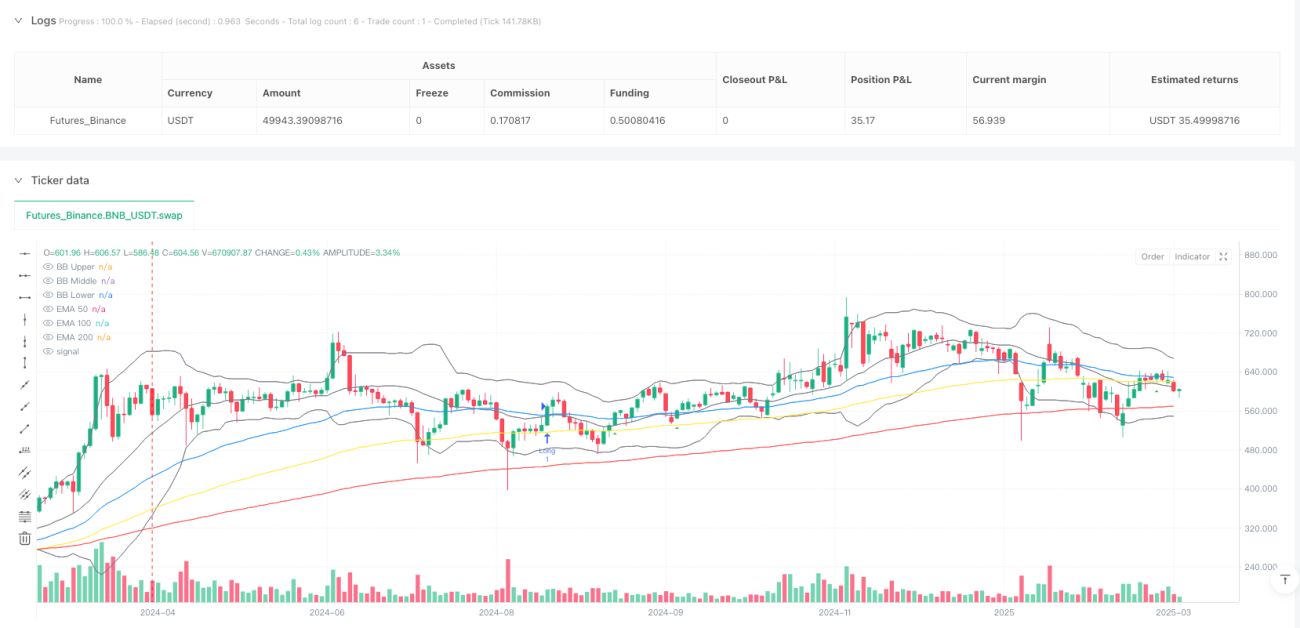
Đây là một chiến lược giao dịch đa chỉ số phức tạp, kết hợp bốn công cụ phân tích kỹ thuật của chỉ số moving average (EMA), chỉ số tương đối mạnh (RSI), moving average converging divergence (MACD) và Bollinger Bands (Bollinger Bands) nhằm xác định các điểm vào giao dịch tiềm năng thông qua nhiều tín hiệu xác minh. Chiến lược này tập trung vào việc nắm bắt chuyển động giá theo xu hướng và giảm khả năng tín hiệu sai thông qua cơ chế lọc tín hiệu nghiêm ngặt.
Nguyên tắc chiến lược
Các nguyên tắc cốt lõi của chiến lược được dựa trên phân tích tổng hợp của bốn chỉ số kỹ thuật quan trọng:
- Sử dụng chỉ số di chuyển trung bình của ba chu kỳ khác nhau ((50, 100, 200) để xác định hướng của xu hướng tổng thể
- Sử dụng chỉ số RSI để đánh giá động lực thị trường và quá mua quá bán
- Đánh giá động lực xu hướng thông qua đường MACD và đường tín hiệu chéo
- Kết hợp với Brin đai lên xuống đường ray như là thêm giá dao động tham chiếu
Logic nhập học cụ thể bao gồm:
-
Có nhiều điều kiện:
- 50 ngày EMA trên giá đóng cửa
- 50 ngày EMA cao hơn 100 ngày EMA, và 100 ngày EMA cao hơn 200 ngày EMA
- RSI giữa 50 và 70
- Đường MACD cao hơn đường tín hiệu
-
Điều kiện:
- EMA 50 ngày dưới mức đóng cửa
- 50 ngày EMA thấp hơn 100 ngày EMA, và 100 ngày EMA thấp hơn 200 ngày EMA
- RSI giữa 30 và 50
- Đường MACD thấp hơn đường tín hiệu
Lợi thế chiến lược
- Xác minh đa chỉ số: tăng đáng kể độ tin cậy tín hiệu thông qua sự kết hợp của bốn chỉ số khác nhau
- Khả năng theo dõi xu hướng mạnh mẽ: sử dụng cấu trúc EMA ba để xác định hiệu quả xu hướng thống trị thị trường
- Động lực phán đoán chính xác: RSI và MACD kết hợp cung cấp thời gian nhập cảnh chính xác hơn
- Kiểm soát rủi ro: Điều kiện nhập cảnh nghiêm ngặt làm giảm khả năng giao dịch sai
- Hiển thị rõ ràng: Chiến lược cung cấp tín hiệu nhập cảnh trực quan rõ ràng và chỉ dẫn xu hướng
Rủi ro chiến lược
- Sự phức tạp của nhiều chỉ số có thể gây ra sự chậm trễ tín hiệu
- Có thể tạo ra nhiều tín hiệu không hiệu quả trong thị trường chấn động
- Các tham số cố định có thể không phù hợp với tất cả các môi trường thị trường
- Không có cơ chế ngăn chặn thiệt hại có nguy cơ rút tiền tiềm tàng cao
Hướng tối ưu hóa chiến lược
- Giới thiệu cơ chế điều chỉnh tham số thích ứng
- Tăng chiến lược dừng lỗ và dừng lại
- Thấp giá nhập khẩu được điều chỉnh theo các động thái khác nhau của chu kỳ thị trường
- Kết hợp với chỉ số dao động để xác minh thêm tín hiệu nhập cảnh
- Sự kết hợp tốt nhất của các tham số chỉ số để đánh giá và tối ưu hóa
Tóm tắt
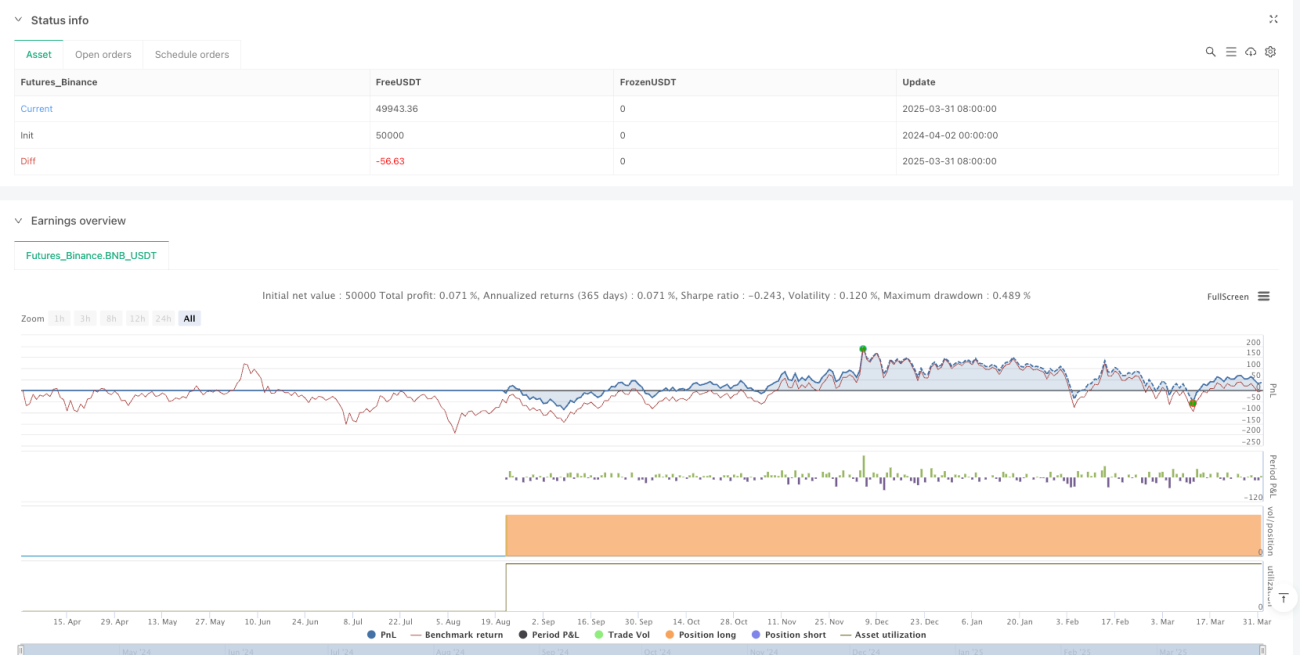
Đây là một chiến lược động lực xu hướng chéo đa tham số có hệ thống hóa cao, được xác minh tổng hợp bằng bốn chỉ số kỹ thuật, nhằm cung cấp tín hiệu giao dịch chính xác và đáng tin cậy hơn. Mặc dù chiến lược có lợi thế rõ rệt, nhưng vẫn cần tối ưu hóa và quản lý rủi ro liên tục.
- 1