Chiến lược dừng lỗ động theo dõi xu hướng dài và ngắn định lượng

Tổng quan
Đây là một chiến lược theo dõi xu hướng đa luồng dựa trên phạm vi biến động thực trung bình (ATR) và đường trung bình di chuyển của chỉ số (EMA). Chiến lược này có thể nắm bắt chính xác và quản lý rủi ro về xu hướng thị trường thông qua các lệnh dừng động và xu hướng.
Nguyên tắc chiến lược
Các nguyên tắc cốt lõi của chiến lược bao gồm các bước quan trọng sau:
- Sử dụng chỉ số ATR để tính toán điểm dừng động
- Kết hợp với EMA để đánh giá xu hướng giá
- Xác định tín hiệu giao dịch bằng vị trí tương đối giữa giá và điểm dừng
- Chọn nhận dạng tín hiệu tối ưu hóa có thể sử dụng Heikin Ashi
Lý luận tính toán chính:
- Điểm dừng động = giá hiện tại ± (ATR * hệ số nhạy cảm)
- Xác định xu hướng dựa trên giao chéo giữa EMA và điểm dừng lỗ
- Tín hiệu giao dịch được tạo ra khi giá vượt qua điểm dừng lỗ và EMA
Lợi thế chiến lược
- Quản lý rủi ro động: ATR tự động tính điểm dừng lỗ, điều chỉnh theo biến động thị trường trong thời gian thực
- Theo dõi xu hướng chính xác: EMA nhanh chóng phản ứng với sự thay đổi giá, nắm bắt các điểm thay đổi xu hướng
- linh hoạt: có thể tùy chỉnh chu kỳ ATR và hệ số nhạy cảm
- Các bản đồ Haykanush tùy chọn để tối ưu hóa hơn nữa nhận dạng tín hiệu
- Giao dịch thấp, giảm chi phí giao dịch
- Thích ứng với nhiều thị trường và nhiều giống
Rủi ro chiến lược
- Thị trường chấn động có thể tạo ra các tín hiệu sai thường xuyên
- Thiết lập tham số không đúng có thể dẫn đến giao dịch quá mức
- Không tính đến các yếu tố cơ bản và tác động của sự kiện bất ngờ
- Có một số sự khác biệt giữa phản hồi và đĩa cứng
Đề xuất kiểm soát rủi ro:
- Tối ưu hóa tham số, giảm hệ số nhạy cảm
- Kết hợp với các chỉ số khác
- Thiết lập dừng lỗ và quản lý vị trí
- Giám sát liên tục và điều chỉnh động
Hướng tối ưu hóa chiến lược
- Giới thiệu các tham số tối ưu hóa động của thuật toán học máy
- Thêm xác thực nhiều chu kỳ thời gian
- Kết hợp với các chỉ số kỹ thuật khác
- Phát triển cơ chế lựa chọn tham số thích ứng
- Thêm mô-đun điều chỉnh rủi ro
Mục tiêu tối ưu hóa: Tăng sự ổn định chiến lược, giảm rút lui và tăng hiệu quả lợi nhuận
Tóm tắt
Đây là một chiến lược theo dõi xu hướng động dựa trên ATR và EMA, để đạt được sự tham gia thị trường tương đối ổn định thông qua các cơ chế dừng lỗ linh hoạt và phán đoán xu hướng. Chiến lược có tính thích ứng tốt và quản lý rủi ro, nhưng vẫn cần được tối ưu hóa và xác minh liên tục.
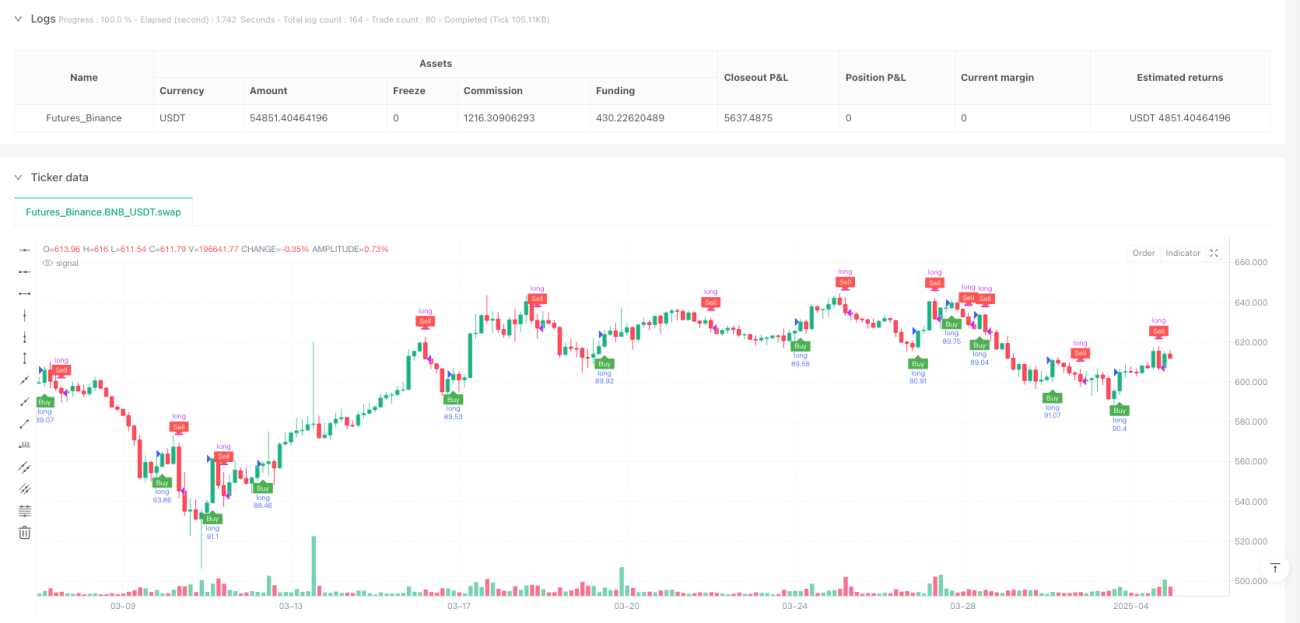
/*backtest
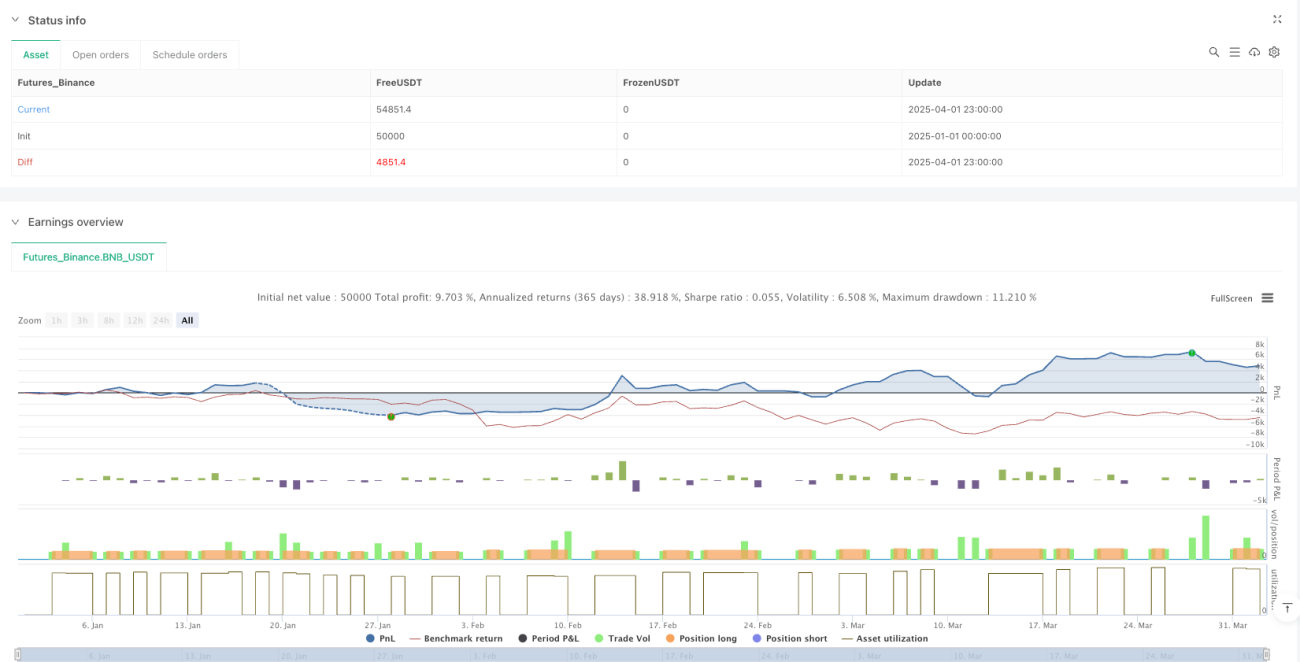
start: 2025-01-01 00:00:00
end: 2025-04-02 00:00:00
period: 3h
basePeriod: 3h
exchanges: [{"eid":"Futures_Binance","currency":"BNB_USDT"}]
*/
//@version=6
strategy("ducanhmaster v1", overlay=true, commission_type=strategy.commission.percent, commission_value=0.1, slippage=3, default_qty_type=strategy.percent_of_equity, default_qty_value=100)
// Inputs- 1