
Tổng quan
Chiến lược động lực tự điều chỉnh theo xu hướng theo thuyết Dow là một phương pháp giao dịch tiên tiến dựa trên các nguyên tắc của lý thuyết Dow cổ điển để hướng dẫn quyết định giao dịch bằng cách xác định các điểm biến động quan trọng trong xu hướng thị trường. Chiến lược này tập trung vào việc phát hiện và xác nhận động lực cơ bản của xu hướng giá, sử dụng các đỉnh cao cao hơn (Higher Highs) và thấp hơn (Higher Lows) để xác định xu hướng tăng, sử dụng các đỉnh cao thấp hơn (Lower Highs) và thấp hơn (Lower Lows) để xác định xu hướng giảm.
Nguyên tắc chiến lược
Nguyên tắc cốt lõi của chiến lược này dựa trên phương pháp nhận diện xu hướng cổ điển của lý thuyết Dow. Chiến lược này sử dụng các hàm ta.pivothigh () và ta.pivotlow () để phát hiện các điểm biến quan trọng. Thực hiện cụ thể bao gồm các bước quan trọng sau:
- Kiểm tra điểm xoay: Sử dụng tham số pivotLookback để xác định số cột ở hai bên bên trái và bên phải, được sử dụng để xác định điểm cao và điểm thấp.
- Xác nhận xu hướng: xu hướng tăng chỉ được xác nhận khi điều kiện cao hơn và thấp hơn được đáp ứng đồng thời; tương tự, xu hướng giảm chỉ được xác nhận khi điều kiện cao hơn và thấp hơn được đáp ứng đồng thời.
- Tiếp tục xu hướng: Nếu điều kiện chuyển đổi xu hướng không được đáp ứng, chiến lược sẽ duy trì trạng thái xu hướng trước đó, do đó có thể theo dõi xu hướng mượt mà hơn.
Lợi thế chiến lược
- Nhận biết xu hướng động: Chiến lược này có thể nắm bắt các thay đổi xu hướng thị trường một cách động, thông qua việc phân tích liên tục các bước ngoặt quan trọng.
- Mô hình giao dịch linh hoạt: cung cấp ba mô hình giao dịch tự động, chỉ làm nhiều và chỉ làm không, đáp ứng nhu cầu của các nhà giao dịch khác nhau.
- Quản lý rủi ro: Có cơ chế dừng lỗ và ngăn chặn tích hợp để kiểm soát rủi ro của một giao dịch.
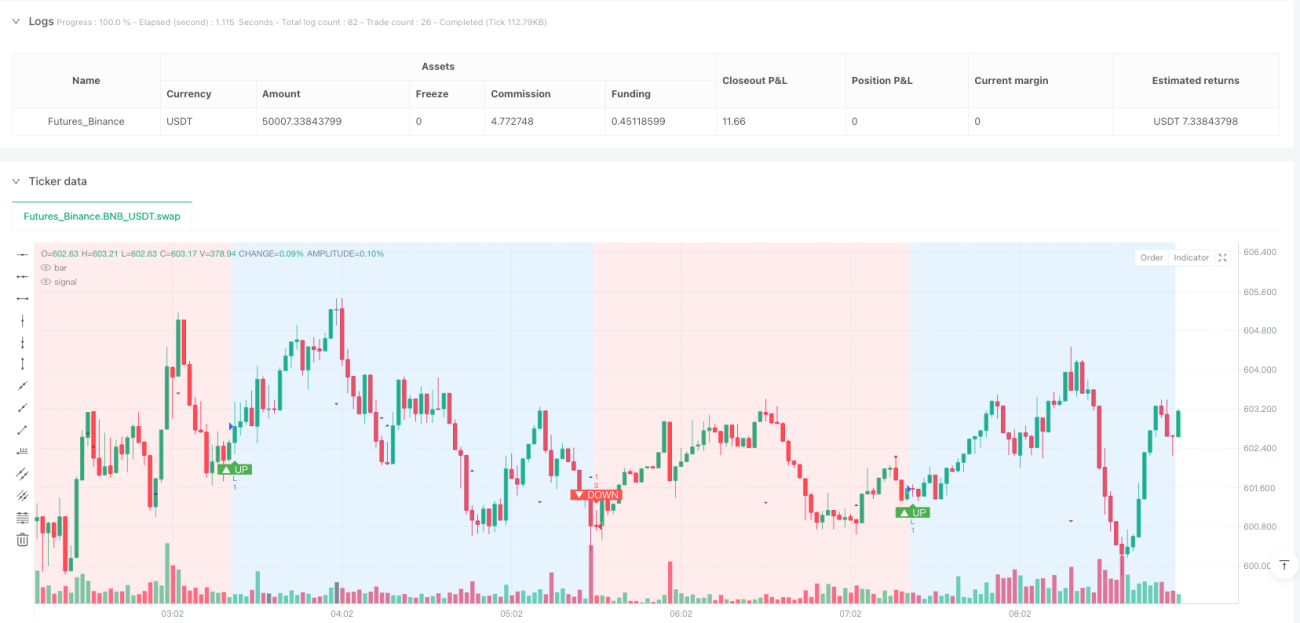
- Xu hướng trực quan: hiển thị trực quan hướng xu hướng thông qua màu nền và dấu hiệu, giúp các nhà giao dịch hiểu nhanh tình trạng thị trường.
- Giảm độ trễ: Phương pháp này phản ứng nhanh hơn với sự thay đổi xu hướng so với các chiến lược trung bình di chuyển truyền thống.
Rủi ro chiến lược
- Rủi ro bị tụt hậu: Do sử dụng phát hiện điểm ngả, chiến lược có nguy cơ bị tụt hậu và có thể không thể nắm bắt được tín hiệu sớm nhất của xu hướng.
- Rủi ro thị trường biến động: Trong thị trường không có biến động rõ ràng, biến động giá nhỏ thường xuyên có thể dẫn đến giao dịch không cần thiết.
- Nhận thức tham số: Lựa chọn tham số pivotLookback có ảnh hưởng lớn đến hiệu suất chiến lược, cần điều chỉnh theo thị trường và khung thời gian khác nhau.
- Chi phí giao dịch: giao dịch thường xuyên có thể dẫn đến chi phí giao dịch cao, đặc biệt là khi tỷ lệ hoa hồng cao.
Hướng tối ưu hóa chiến lược
- Thêm bộ lọc bổ sung: kết hợp các chỉ số cường độ xu hướng (như ATR) để lọc các tín hiệu xu hướng yếu.
- Điều chỉnh tham số động: Phát triển cơ chế tham số pivot Lookback tự thích ứng dựa trên biến động của thị trường.
- Xác minh đa khung thời gian: Xác minh tín hiệu xu hướng trên các khung thời gian khác nhau, tăng độ tin cậy của tín hiệu.
- Tăng cường học máy: khám phá cách sử dụng các thuật toán học máy để tối ưu hóa nhận dạng xu hướng và thời gian nhập học.
- Tối ưu hóa quản lý rủi ro: Điều chỉnh dừng lỗ và khoảng cách dừng lại theo động thái biến động của thị trường.
Tóm tắt
Chiến lược động lực tự thích ứng theo thuyết Dow là một phương pháp theo dõi xu hướng mạnh mẽ, cung cấp cho các nhà giao dịch một công cụ nhận diện xu hướng có hệ thống thông qua các công nghệ phân tích điểm ngã sáng tạo. Mặc dù có một số rủi ro vốn có, tính linh hoạt và động của nó làm cho nó trở thành một phương pháp có giá trị trong chiến lược giao dịch định lượng hiện đại. Để áp dụng thành công chiến lược này cần hiểu sâu về nguyên tắc hoạt động của nó và liên tục tối ưu hóa và điều chỉnh theo môi trường thị trường cụ thể.
Overview
The Dow Theory Trend Adaptive Momentum Strategy is an advanced trading approach based on classic Dow Theory principles, designed to guide trading decisions by identifying key turning points in market trends. The strategy focuses on detecting and confirming the fundamental dynamics of price trends, using Higher Highs and Higher Lows to define uptrends, and Lower Highs and Lower Lows to define downtrends. This method aims to provide a systematic approach to capturing market trends and responding promptly when trends change.
Strategy Principles
The core principle of this strategy is based on the classic Dow Theory trend identification method. The strategy detects key turning points using ta.pivothigh() and ta.pivotlow() functions. Specific implementation includes the following key steps:
- Turning Point Detection: Use the pivotLookback parameter to determine the number of bars on both sides for identifying highs and lows.
- Trend Confirmation: An uptrend is confirmed only when both Higher Highs and Higher Lows conditions are met; similarly, a downtrend is confirmed only when both Lower Highs and Lower Lows conditions are satisfied.
- Trend Persistence: If trend conversion conditions are not met, the strategy maintains the previous trend state, achieving smoother trend tracking.
Strategy Advantages
- Dynamic Trend Identification: By continuously analyzing key turning points, the strategy can dynamically capture market trend changes.
- Flexible Trading Modes: Provides three trading modes - automatic, long-only, and short-only - to meet different traders' needs.
- Risk Management: Built-in stop-loss and take-profit mechanisms effectively control the risk of individual trades.
- Trend Visualization: Intuitively displays trend direction through background colors and markers, making it easy for traders to understand market conditions.
- Low Latency: Compared to traditional moving average strategies, this method can respond to trend changes more quickly.
Strategy Risks
- Lag Risk: Due to using pivot point detection, the strategy inherently carries a lag risk and may not capture the earliest trend signals.
- Ranging Market Risk: In markets with unclear fluctuations, frequent small price changes may lead to unnecessary trades.
- Parameter Sensitivity: The choice of pivotLookback parameter significantly impacts strategy performance and requires adjustment for different markets and timeframes.
- Trading Costs: Frequent trading may result in high transaction costs, especially with higher commission rates.
Strategy Optimization Directions
- Introduce Additional Filters: Combine trend strength indicators (such as ATR) to filter weak trend signals.
- Dynamic Parameter Adjustment: Develop an adaptive pivotLookback parameter mechanism based on market volatility.
- Multi-Timeframe Verification: Cross-verify trend signals across different timeframes to improve signal reliability.
- Machine Learning Enhancement: Explore using machine learning algorithms to optimize trend identification and entry timing.
- Risk Management Optimization: Dynamically adjust stop-loss and take-profit distances based on market volatility.
Conclusion
The Dow Theory Trend Adaptive Momentum Strategy is a powerful trend-following method that provides traders with a systematic trend identification tool through innovative turning point analysis techniques. Despite some inherent risks, its flexibility and dynamism make it a valuable approach in modern quantitative trading strategies. Successfully applying this strategy requires a deep understanding of its working principles and continuous optimization and adjustment based on specific market environments.
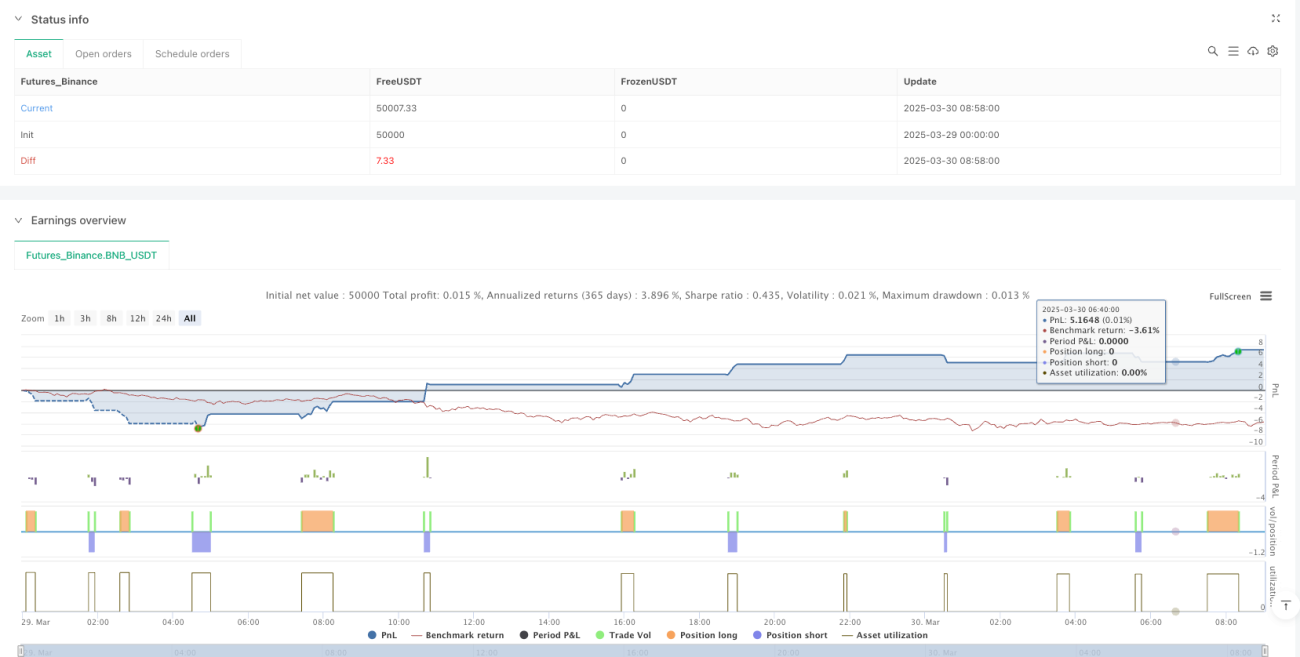
/*backtest
start: 2025-03-29 00:00:00
end: 2025-03-30 09:00:00
period: 2m
basePeriod: 2m
exchanges: [{"eid":"Futures_Binance","currency":"BNB_USDT"}]
*/

//@version=5
// strategy(title="Dow Theory Trend Strategy v3", shorttitle="Dow Trend Strat v3", overlay=true,
//      initial_capital=10000, default_qty_type=strategy.percent_of_equity, default_qty_value=10,
// commission_type=strategy.commission.percent, commission_value=0.1, // Example strategy settings with commission- 1