Chiến lược chỉ báo KDJ động thích ứng nhiều khung thời gian

MTF-ADK ATR EMA KDJ TSL
Ngày tạo: 2025-04-03 14:27:21 sửa đổi lần cuối: 2025-04-03 15:13:59
sao chép: 0 Số nhấp chuột: 429
2
tập trung vào
319
Người theo dõi

Chiến lược chỉ báo KDJ động thích ứng nhiều khung thời gian Chiến lược chỉ báo KDJ động thích ứng nhiều khung thời gian

Tổng quan

Đây là một chiến lược chỉ số biến động KDJ tự điều chỉnh đa khung thời gian sáng tạo, nhằm cung cấp tín hiệu giao dịch chính xác và linh hoạt hơn bằng cách điều chỉnh động các tham số chỉ số và phân tích xu hướng thị trường trên nhiều khung thời gian. Chiến lược này kết hợp tính toán chiều dài dựa trên biến động, phân bổ trọng lượng trên nhiều khung thời gian và phán đoán xu hướng tự điều chỉnh, cung cấp cho các nhà giao dịch một công cụ phân tích phức tạp và mạnh mẽ.

Nguyên tắc chiến lược

Các nguyên tắc cốt lõi của chiến lược bao gồm các công nghệ then chốt sau:

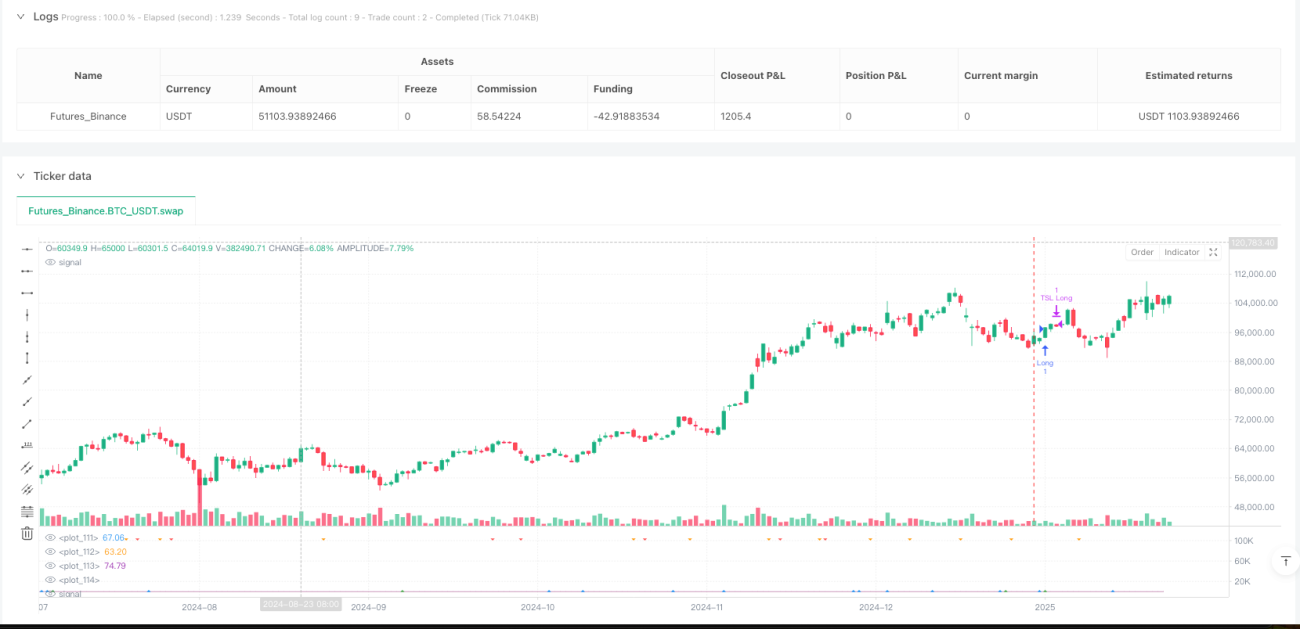
  1. Phân tích nhiều khung thời gian: sử dụng ba khung thời gian đồng thời là 1 phút, 5 phút và 15 phút
  2. Tính toán độ dài swing tự điều chỉnh: tham số chỉ số điều chỉnh động dựa trên biến động tỷ lệ thị trường
  3. Phân bổ trọng lượng động: phân bổ hệ số trọng lượng khác nhau cho các khung thời gian khác nhau
  4. Cơ chế phán đoán xu hướng: Xác định hướng xu hướng thị trường bằng cách tính trung bình của Smooth AvgTotal
  5. Tạo tín hiệu thông minh: kết hợp tín hiệu chính và tín hiệu dự đoán để tăng độ chính xác tín hiệu

Lợi thế chiến lược

  1. Tính linh hoạt cao: có thể tùy chỉnh khung thời gian và cấu hình trọng lượng
  2. Tính linh hoạt: điều chỉnh các tham số chỉ số theo biến động của thị trường
  3. Phân tích đa chiều: tổng hợp thông tin từ nhiều khung thời gian
  4. Tín hiệu chậm trễ thấp: bao gồm tín hiệu chính và tín hiệu dự kiến
  5. Bộ lọc xu hướng tích hợp: giảm tín hiệu sai trong điều kiện thị trường bất lợi

Rủi ro chiến lược

  1. Rủi ro của tham số quá phù hợp
  2. Nhiều khung thời gian có thể làm tăng sự phức tạp của tín hiệu
  3. Tín hiệu tín hiệu có thể giảm đáng tin cậy trong điều kiện thị trường cực đoan
  4. Cần thêm xác nhận tín hiệu xác nhận chỉ số

Hướng tối ưu hóa chiến lược

  1. Giới thiệu các thuật toán học máy để điều chỉnh trọng lượng động
  2. Thêm điều kiện lọc bổ sung
  3. Tối ưu hóa hệ thống ngăn chặn thiệt hại
  4. Phát triển sự thích ứng giữa các giống

Tóm tắt

Khung đa thời gian này thích nghi với chiến lược chỉ số dao động của KDJ thông qua thiết kế sáng tạo, cung cấp cho các nhà giao dịch một công cụ phân tích thị trường linh hoạt, năng động và đa chiều, có lợi thế kỹ thuật đáng kể và không gian nâng cao hiệu suất tiềm năng.

Mã nguồn chiến lược
/*backtest
start: 2025-01-01 00:00:00
end: 2025-01-25 00:00:00
period: 1d
basePeriod: 1d
exchanges: [{"eid":"Futures_Binance","currency":"BTC_USDT"}]
*/

// This Pine Script™ is subject to the Mozilla Public License 2.0 (https://mozilla.org/MPL/2.0/)
// © Lausekopf

//@version=5
strategy("Adaptive KDJ (MTF)", overlay=false)

// Dropdown for the swing length calculation method
method = input.int(1, title="Calculation Method", options=[1, 2, 3], tooltip="1: Volatility Based\n2: Inverse Volatility\n3: Fixed Length")

// Fixed length for method 3
fixedLength = input.int(9, title="Fixed KDJ Length", minval=3, maxval=15)

// Timeframes
tf1 = input.timeframe("1", title="Timeframe 1")
tf2 = input.timeframe("5", title="Timeframe 2")
tf3 = input.timeframe("15", title="Timeframe 3")

// Timeframe weighting
weightOption = input.int(1, title="Timeframe Weighting", options=[1, 2, 3, 4, 5])
weightTF1 = weightOption == 1 ? 0.5 : weightOption == 2 ? 0.4 : weightOption == 3 ? 0.33 : weightOption == 4 ? 0.2 : 0.1
weightTF2 = 0.33
weightTF3 = 1.0 - (weightTF1 + weightTF2)

// EMA smoothing length
smoothingLength = input.int(5, title="EMA Smoothing Length", minval=1, maxval=50)

// Trend calculation period
trendLength = input.int(40, title="Trend Calculation Period", minval=5, maxval=50)

// KDJ function
f_kdj(len, srcHigh, srcLow, srcClose) =>
    roundedLen = int(math.round(len))
    high_max = ta.highest(srcHigh, roundedLen)
    low_min = ta.lowest(srcLow, roundedLen)
    rsv = 100 * (srcClose - low_min) / (high_max - low_min)
    k = ta.sma(rsv, 3)
    d = ta.sma(k, 3)
    j = 3 * k - 2 * d
    [k, d, j]

// Swing length function
f_swingLength(tf) =>
    atrLen = 14
    volatility = request.security(syminfo.tickerid, tf, ta.atr(atrLen) / close)
    var float length = na
    if method == 1
        length := volatility > 0.03 ? 3 : volatility > 0.002 ? 14 : 15
    if method == 2
        length := 18
    if method == 3
        length := fixedLength
    length

// Calculate swing lengths for each timeframe
swingLength1 = f_swingLength(tf1)
swingLength2 = f_swingLength(tf2)
swingLength3 = f_swingLength(tf3)

// Calculate KDJ values
[k1, d1, j1] = f_kdj(swingLength1, request.security(syminfo.tickerid, tf1, high), request.security(syminfo.tickerid, tf1, low), request.security(syminfo.tickerid, tf1, close))
[k2, d2, j2] = f_kdj(swingLength2, request.security(syminfo.tickerid, tf2, high), request.security(syminfo.tickerid, tf2, low), request.security(syminfo.tickerid, tf2, close))
[k3, d3, j3] = f_kdj(swingLength3, request.security(syminfo.tickerid, tf3, high), request.security(syminfo.tickerid, tf3, low), request.security(syminfo.tickerid, tf3, close))

// Weighted averages
avgK = (k1 * weightTF1 + k2 * weightTF2 + k3 * weightTF3)
avgD = (d1 * weightTF1 + d2 * weightTF2 + d3 * weightTF3)
avgJ = (j1 * weightTF1 + j2 * weightTF2 + j3 * weightTF3)
smoothAvgK = ta.ema(avgK, smoothingLength)
smoothAvgD = ta.ema(avgD, smoothingLength)
smoothAvgJ = ta.ema(avgJ, smoothingLength)
smoothAvgTotal = ta.ema((avgK + avgD + avgJ) / 3, smoothingLength)

// Trend determination
trendAvg = ta.sma(smoothAvgTotal, trendLength)
isUptrend = trendAvg > 60
isDowntrend = trendAvg < 40

// Dynamic signal thresholds
buyLevel = isUptrend ? 40 : isDowntrend ? 15 : 25
sellLevel = isUptrend ? 85 : isDowntrend ? 60 : 75

// Buy/Sell signals
buySignal = smoothAvgJ < buyLevel and ta.crossover(smoothAvgK, smoothAvgD)
sellSignal = smoothAvgJ > sellLevel and ta.crossunder(smoothAvgK, smoothAvgD)

// Anticipated signals
anticipateBuy = (smoothAvgK - smoothAvgK[1]) > 0 and (smoothAvgD - smoothAvgD[1]) < 0 and math.abs(smoothAvgK - smoothAvgD) < 5
anticipateSell = (smoothAvgK - smoothAvgK[1]) < 0 and (smoothAvgD - smoothAvgD[1]) > 0 and math.abs(smoothAvgK - smoothAvgD) < 5

// Entry conditions
longEntryCondition = (buySignal or anticipateBuy) and smoothAvgTotal < 22
shortEntryCondition = (sellSignal or anticipateSell) and smoothAvgTotal > 78

// Entry orders
strategy.entry("Long", strategy.long, when=longEntryCondition)
strategy.entry("Short", strategy.short, when=shortEntryCondition)

// Trailing Stop-Loss
atrMultiplierTSL = 2.5
atrValueTSL = ta.atr(12) * atrMultiplierTSL
strategy.exit("TSL Long", from_entry="Long", trail_points=atrValueTSL / syminfo.mintick, stop=open * 0.9972)
strategy.exit("TSL Short", from_entry="Short", trail_points=atrValueTSL / syminfo.mintick, stop=open * 1.0028)

// Plot signals
plotshape(series=buySignal, location=location.bottom, style=shape.triangleup, color=color.green, size=size.small)
plotshape(series=sellSignal, location=location.top, style=shape.triangledown, color=color.red, size=size.small)
plotshape(series=anticipateBuy, location=location.bottom, style=shape.triangleup, color=color.blue, size=size.tiny, offset=-1)
plotshape(series=anticipateSell, location=location.top, style=shape.triangledown, color=color.orange, size=size.tiny, offset=-1)

// Plot KDJ lines
plot(smoothAvgK, color=color.blue, linewidth=1)
plot(smoothAvgD, color=color.orange, linewidth=1)
plot(smoothAvgJ, color=color.purple, linewidth=1)
plot(smoothAvgTotal, color=color.white, linewidth=1)

// Alert for impending signals
alertcondition(anticipateBuy or anticipateSell, title='Impending KDJ Crossover', message='Possible KDJ crossover detected!')
// This Pine Script™ code is subject to the terms of the Mozilla Public License 2.0 at https://mozilla.org/MPL/2.0/
// © Lausekopf