
Tổng quan
Chiến lược chốt lời động DCA xác nhận nhiều chỉ báo phá vỡ đường trung bình động là một hệ thống giao dịch ngắn hạn nâng cao, kết hợp phân tích kỹ thuật với phương pháp trung bình chi phí đô la (DCA). Chiến lược này sử dụng nhiều chỉ báo kỹ thuật như EMA 48, RSI 14, MACD và Bollinger Bands để xác nhận điểm vào tiềm năng, đồng thời triển khai phương pháp quản lý vị thế có cấu trúc và cơ chế kiểm soát rủi ro được xác định trước. Cốt lõi của chiến lược là xác định điểm giao nhau giữa giá và EMA, sử dụng RSI, MACD và Bollinger Bands để xác nhận, kết hợp phân tích khung thời gian cao để tránh tín hiệu nhiễu, áp dụng chiến lược DCA ba cấp để tăng vị thế, và bảo vệ lợi nhuận thông qua chốt lời nhiều cấp và cắt lỗ động.
Nguyên lý chiến lược
Nguyên lý của chiến lược này dựa trên sự kết hợp xác nhận của nhiều chỉ báo kỹ thuật, bao gồm các thành phần chính sau:
-
Hệ thống điều kiện vào lệnh:
- Giá phải vượt qua EMA chu kỳ 48, với xu hướng tăng thì vượt lên trên, xu hướng giảm thì vượt xuống dưới
- RSI phải xác nhận sức mạnh hướng (khi xu hướng tăng >60, khi xu hướng giảm <40)
- Đường MACD phải vượt qua đường tín hiệu, xác nhận hướng động lượng
- Giá phải tiếp cận vùng hỗ trợ/kháng cự trước đó
- RSI hiển thị tín hiệu phân kỳ tại đỉnh/đáy thứ 5
- Khung thời gian cao xác nhận đây là vị trí trụ thứ hai
-
Quản lý vị thế động:
- Rủi ro ban đầu giới hạn 1-3% tài khoản
- Quy mô vị thế tuân theo tỷ lệ DCA 1-2-6 để tăng vị thế
- Cắt lỗ đầu tiên đặt tại 1-3% so với điểm vào, tính bằng đơn vị tiền tệ
- Sau khi triển khai toàn bộ DCA, cắt lỗ được cập nhật đến vị trí 1,3% so với điểm vào
-
Cơ chế chốt lời thông minh:
- Khi giá đạt lợi nhuận 0,5%, đóng 25% vị thế
- Khi giá đạt lợi nhuận 1%, đóng 50% vị thế
- Sau lần chốt lời thứ hai, cắt lỗ di chuyển đến điểm hòa vốn
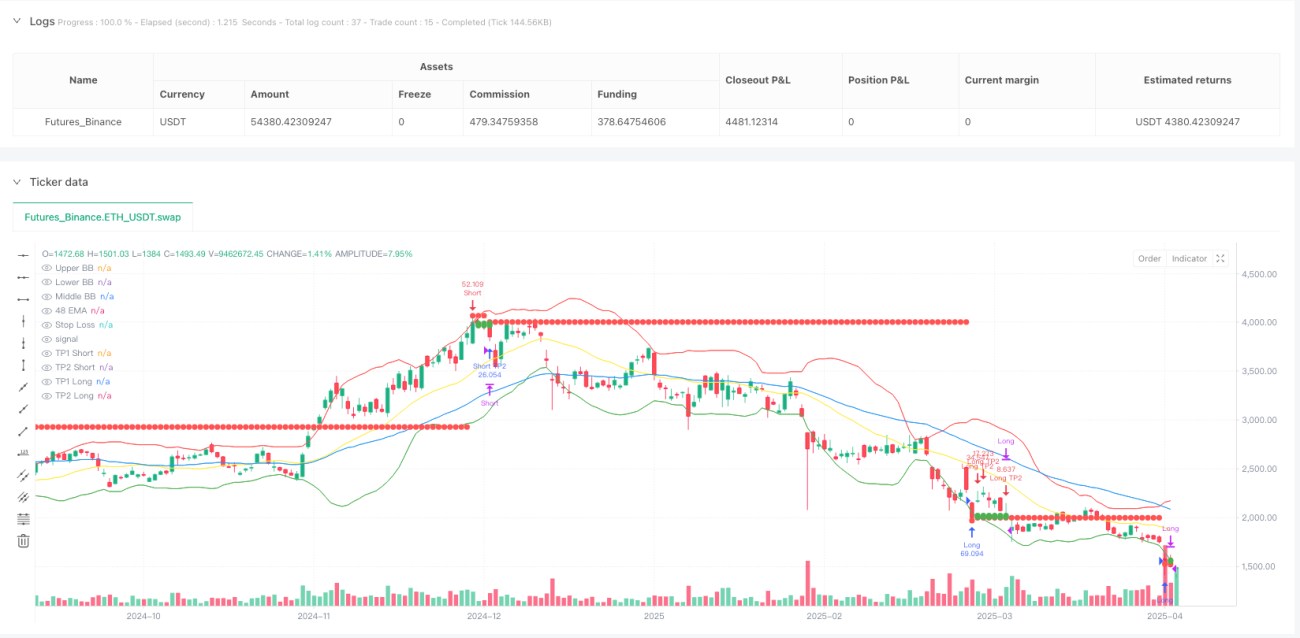
Phân tích chuyên sâu mã nguồn cho thấy chiến lược này còn bao gồm hệ thống nhận dạng đỉnh đáy thông minh, theo dõi 5 điểm dao động gần nhất của giá và RSI để phát hiện mô hình phân kỳ. Hệ thống xác nhận khung thời gian cao phân tích các mức hỗ trợ và kháng cự trên biểu đồ ngày để tránh tín hiệu nhiễu trên khung thời gian thấp.
Ưu điểm chiến lược
Phân tích sâu mã nguồn chiến lược, chúng ta có thể tổng kết những ưu điểm nổi bật sau:
-
Hệ thống xác nhận đa cấp: Thông qua sự phối hợp của nhiều chỉ báo kỹ thuật, giảm đáng kể khả năng tín hiệu nhiễu, tăng tỷ lệ thắng. Việc kết hợp EMA, RSI, MACD và Bollinger Bands đảm bảo chất lượng điểm vào cao.
-
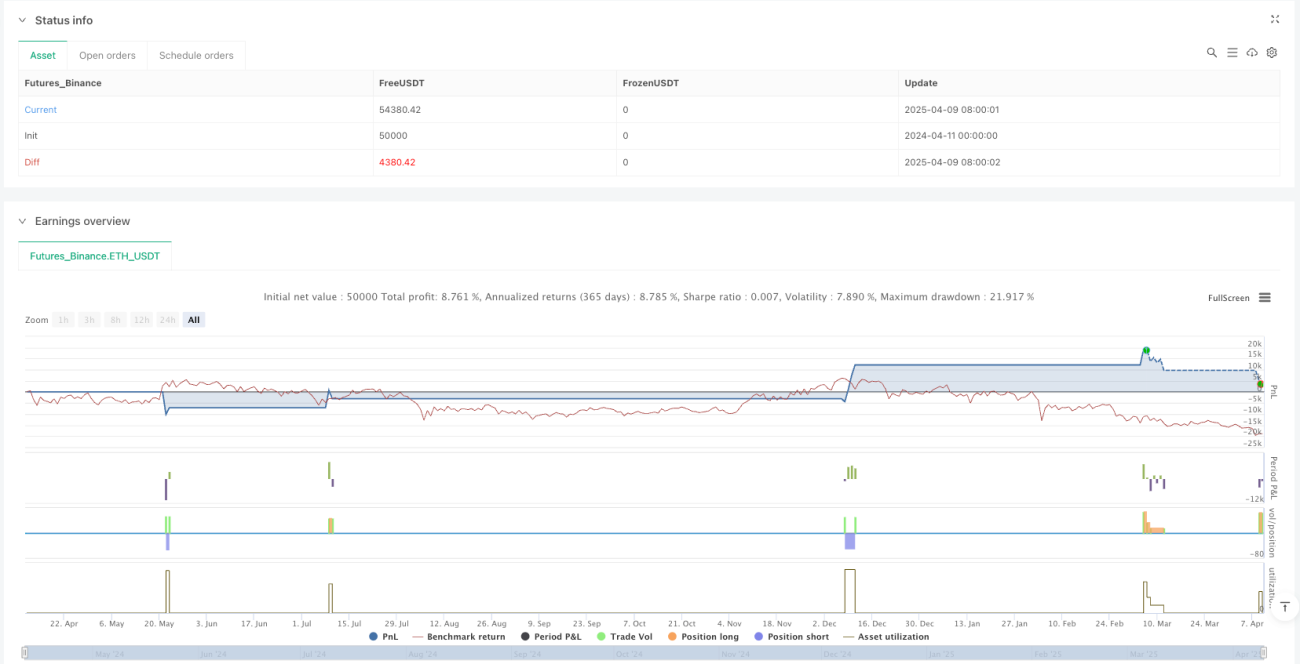
Quản lý vốn thông minh: Phương pháp tỷ lệ DCA 1-2-6 vừa tận dụng biến động thị trường để trung bình hóa chi phí, vừa hạn chế tổng rủi ro. Rủi ro ban đầu chỉ giới hạn 1-3% tài khoản, đảm bảo ngay cả trong tình huống xấu nhất cũng không gây thiệt hại nghiêm trọng.
-
Bảo vệ cắt lỗ động: Cơ chế cắt lỗ được điều chỉnh theo diễn biến giao dịch, đặc biệt sau khi đạt một phần lợi nhuận, cắt lỗ được chuyển đến điểm hòa vốn, cân bằng hiệu quả giữa bảo vệ lợi nhuận và cho phép giao dịch có không gian biến động.
-
Chiến lược chốt lời theo giai đoạn: Bằng cách đóng 25% và 50% vị thế tại các điểm lợi nhuận 0,5% và 1%, chiến lược có thể khóa một phần lợi nhuận, đồng thời giữ vị thế để nắm bắt biến động thị trường lớn hơn, đạt được sự cân bằng giữa rủi ro và lợi nhuận.
-
Xác nhận khung thời gian cao: Sử dụng các mức hỗ trợ và kháng cự từ khung thời gian cao hơn để lọc tín hiệu giao dịch, giảm tác động của nhiễu và phá vỡ giả thường thấy trên khung thời gian thấp.
Rủi ro chiến lược
Mặc dù chiến lược được thiết kế tinh vi, vẫn tồn tại một số yếu tố rủi ro cần lưu ý:
-
Nhạy cảm với tham số: Hiệu suất chiến lược phụ thuộc rất nhiều vào cài đặt nhiều tham số, bao gồm chu kỳ EMA, ngưỡng RSI và mức DCA. Những thay đổi nhỏ trong các tham số này có thể dẫn đến sự khác biệt đáng kể trong kết quả giao dịch, đòi hỏi tối ưu hóa và backtest cẩn thận.
-
Rủi ro biến động lớn: Mặc dù có cơ chế DCA, khi thị trường biến động mạnh, giá có thể vượt qua nhanh chóng tất cả các mức cắt lỗ đã đặt, dẫn đến tổn thất thực tế vượt quá dự kiến. Để đối phó với rủi ro này, có thể xem xét sử dụng quy mô vị thế ban đầu chặt chẽ hơn hoặc tạm dừng giao dịch trong thời kỳ biến động cao.
-
Hiệu ứng cộng dồn của các lỗ liên tiếp: Mặc dù rủi ro từng giao dịch có hạn, các lỗ liên tiếp vẫn có thể dẫn đến suy giảm đáng kể đường cong vốn. Khuyến nghị thực hiện thêm các biện pháp kiểm soát rủi ro tổng thể, như giới hạn thua lỗ tối đa hàng ngày hoặc hàng tuần.
-
Độ phức tạp trong nhận dạng phân kỳ RSI: Việc phát hiện phân kỳ RSI trong mã nguồn phụ thuộc vào độ chính xác của dữ liệu lịch sử, có thể không đủ tin cậy trong một số điều kiện thị trường. Có thể xem xét sử dụng các phương pháp thống kê tiên tiến hơn để xác nhận tín hiệu phân kỳ.
-
Phụ thuộc vào thanh khoản thị trường: Trong các thị trường có thanh khoản thấp, các lệnh DCA với khối lượng lớn có thể đối mặt với vấn đề trượt giá, ảnh hưởng đến hiệu quả tổng thể của chiến lược. Nên giới hạn việc sử dụng chiến lược này trong các thị trường có thanh khoản cao.
Hướng tối ưu hóa chiến lược
Dựa trên phân tích chuyên sâu mã nguồn, đây là một số hướng có thể tối ưu hóa chiến lược:
-
Điều chỉnh tham số động: Có thể đưa vào cơ chế điều chỉnh tham số động dựa trên biến động thị trường. Ví dụ, tự động tăng yêu cầu ngưỡng RSI trong thời kỳ biến động cao, hoặc điều chỉnh độ dài EMA để phù hợp với các chu kỳ thị trường khác nhau. Cơ chế thích ứng như vậy có thể nâng cao độ chắc chắn của chiến lược trong các môi trường thị trường khác nhau.
-
Tăng cường phát hiện phân kỳ: Việc phát hiện phân kỳ RSI hiện tại tương đối đơn giản, có thể cải thiện độ chính xác bằng cách đưa vào các thuật toán phức tạp hơn, như sử dụng RSI chuyển đổi Fisher hoặc thêm xác nhận khối lượng. Điều này sẽ giảm tín hiệu sai, nâng cao độ chính xác của chiến lược.
-
Tối ưu hóa chốt lời thông minh: Các điểm chốt lời cố định hiện tại có thể được cải thiện thành điểm chốt lời động dựa trên biến động thị trường. Ví dụ, đặt mục tiêu chốt lời cao hơn trong thời kỳ biến động cao, và thấp hơn trong thời kỳ biến động thấp, để thích ứng với sự thay đổi của điều kiện thị trường.
-
Chi tiết hóa quản lý vốn: Có thể tối ưu hóa tỷ lệ DCA và điểm kích hoạt, điều chỉnh linh hoạt dựa trên cấu trúc thị trường và sức mạnh xu hướng hiện tại. Ví dụ, sử dụng tỷ lệ DCA tích cực hơn trong xu hướng mạnh, và thận trọng hơn trong xu hướng yếu.
-
Tối ưu hóa thời gian giao dịch: Đưa vào bộ lọc thời gian dựa trên khối lượng và biến động, tránh giao dịch trong các khung thời gian ít hoạt động. Điều này có thể đạt được bằng cách phân tích dữ liệu lịch sử để xác định cửa sổ thời gian giao dịch tối ưu.
Tổng kết
Chiến lược chốt lời động DCA xác nhận nhiều chỉ báo phá vỡ đường trung bình động là một hệ thống giao dịch ngắn hạn được thiết kế tốt, kết hợp khéo léo nhiều công cụ phân tích kỹ thuật với kỹ thuật quản lý vốn tiên tiến. Thông qua sự phối hợp của các chỉ báo EMA, RSI, MACD và Bollinger Bands, chiến lược này có thể xác định các điểm vào có xác suất cao, đồng thời sử dụng phương pháp DCA có cấu trúc và cơ chế cắt lỗ/chốt lời động để quản lý rủi ro và khóa lợi nhuận.
Mặc dù chiến lược có những ưu điểm rõ ràng, bao gồm kiểm soát rủi ro chặt chẽ, hệ thống xác nhận đa cấp và cơ chế chốt lời thông minh, người dùng vẫn cần cảnh giác với độ nhạy tham số và rủi ro từ biến động thị trường mạnh. Bằng cách thực hiện các biện pháp tối ưu hóa được đề xuất, như điều chỉnh tham số động, tăng cường phát hiện phân kỳ và tối ưu hóa chốt lời thông minh, độ chắc chắn và khả năng sinh lời của chiến lược có thể được cải thiện hơn nữa.
Đối với nhà giao dịch, chiến lược này phù hợp nhất để áp dụng trên các thị trường có đủ thanh khoản, và cần được backtest lịch sử kỹ lưỡng cũng như tối ưu hóa tham số trước khi sử dụng. Thông qua việc thực hiện cẩn thận và giám sát điều chỉnh liên tục, hệ thống giao dịch đa cấp này có thể trở thành một vũ khí mạnh mẽ trong bộ công cụ của nhà giao dịch ngắn hạn.
- 1