
Chiến lược giao dịch định lượng tự điều chỉnh cơ chế thị trường theo khung thời gian đa là một hệ thống giao dịch định lượng cao cấp dựa trên phân tích tổng hợp đa chỉ số, có thể tự động điều chỉnh chiến lược giao dịch của nó theo các điều kiện thị trường khác nhau. Chiến lược này sử dụng trí tuệ nhân tạo để tự điều chỉnh kỹ thuật để xác định bốn cơ chế thị trường: xu hướng, phân đoạn, biến động và tĩnh, và điều chỉnh các tham số giao dịch theo động lực của tình trạng thị trường hiện tại. Các công nghệ cốt lõi bao gồm phân tích khung thời gian đa, nhận dạng hình ảnh đồ thị, quản lý rủi ro động lực và thuật toán tự tối ưu hóa, cung cấp cho các nhà giao dịch một công cụ giao dịch toàn diện và linh hoạt.
Cốt lõi của chiến lược này nằm trong khung phân tích thị trường đa tầng của nó, cho phép phát hiện chính xác tình trạng thị trường và tạo tín hiệu thông qua việc tích hợp nhiều chỉ số kỹ thuật:
Hệ thống trung bình di chuyển: Sử dụng chỉ số di chuyển trung bình ((9 chu kỳ) và chậm ((34 chu kỳ) để xác định hướng xu hướng, kết hợp với ATR Threshold để tăng độ chính xác phán đoán.
Cơ chế xác nhận khung thời gian đa dạng: Cung cấp tầm nhìn thị trường toàn diện hơn thông qua các chỉ số RSI và MACD trong các chu kỳ thời gian cao hơn, lọc các tín hiệu tiếng ồn trong các chu kỳ thời gian thấp. Chiến lược đặc biệt chú trọng vào xác nhận xu hướng trong các khung thời gian cao, sử dụng giao điểm của HTF_RSI và HTF_MACD làm bộ lọc sức mạnh.
Thuật toán nhận diện cơ chế thị trường:
Nhận dạng hình dạng và xác nhận số lượng giao dịchChiến lược phát hiện nhiều hình dạng biểu đồ có xác suất cao, bao gồm hình dạng ăn thịt, đường nón, hình dạng sao mai, đường xuyên, hai đáy, và hình dạng tương ứng giảm của nó. Mỗi hình dạng cần xác nhận khối lượng giao dịch và tăng độ tin cậy tín hiệu.
Hệ thống đánh giá đa yếu tốĐánh giá tổng hợp các chỉ số kỹ thuật, nhận dạng hình dạng và khối lượng giao dịch, tạo ra một điểm tổng hợp. Điểm mua yêu cầu thị trường bò ≥1.0, và điểm bán yêu cầu thị trường gấu ≥1.0.
Hạn chế động và theo dõi: Sử dụng ATR để tính toán mức dừng động, đảm bảo quản lý rủi ro phù hợp với biến động của thị trường. Khoảng cách dừng tự động điều chỉnh theo giá trị ATR, mở rộng khi biến động tăng và thu hẹp khi biến động giảm.
Theo dõi hiệu suất tự tối ưu hóaHệ thống ghi lại hiệu suất giao dịch dưới các cơ chế thị trường khác nhau để điều chỉnh các tham số giao dịch và điểm giảm giá, để thực hiện tối ưu hóa tùy chỉnh chiến lược.
Khả năng thích ứng trên toàn thị trườngƯu điểm nổi bật nhất của chiến lược này là khả năng tự động nhận diện và thích ứng với bốn trạng thái thị trường khác nhau, tránh các hạn chế của một chiến lược duy nhất trong môi trường thị trường thay đổi. Cho dù thị trường có xu hướng mạnh, sắp xếp ngang, biến động cao hay biến động thấp, hệ thống có thể điều chỉnh các tham số và mức giảm tín hiệu.
Xác nhận khung thời gian đa dạngBằng cách tích hợp các chỉ số về chu kỳ thời gian cao hơn, chiến lược này đã cải thiện đáng kể chất lượng tín hiệu. Phương pháp phân tích “lên xuống” này đã lọc hiệu quả các tín hiệu chất lượng thấp, giảm đột phá giả và giao dịch tiếng ồn.
Nhận dạng dạng cao: Kết hợp xác nhận khối lượng giao thông với nhận dạng hình dạng hình vẽ cung cấp tín hiệu nhập cảnh có xác suất cao. Những hình dạng này đặc biệt hiệu quả khi xuất hiện gần các vị trí hỗ trợ và kháng cự và đi kèm với khối lượng giao thông tăng lên.
Quản lý rủi ro độngCơ chế dừng lỗ và theo dõi dừng lỗ dựa trên ATR đảm bảo quản lý rủi ro có thể tự động điều chỉnh theo biến động của thị trường. Phương pháp này, trong khi bảo vệ vốn, cũng cho phép các vị trí lợi nhuận tiếp tục hoạt động, tối ưu hóa tỷ lệ lợi nhuận rủi ro.
Cơ chế tự tối ưu hóaChiến lược có thể ghi lại hoạt động của các cơ chế thị trường khác nhau, cung cấp thông tin phản hồi và cơ sở điều chỉnh cho các giao dịch trong tương lai, và tự hoàn thiện liên tục.
Giám sát hình ảnhThông qua nền tảng và bảng hiệu suất mã hóa màu, các nhà giao dịch có thể hiểu trực quan về tình trạng thị trường hiện tại, hiệu suất chiến lược và các chỉ số quan trọng, tăng tính minh bạch của hoạt động.
Độ nhạy tham sốChiến lược này sử dụng nhiều tham số và ngưỡng để xác định cơ chế thị trường và tạo tín hiệu. Các thiết lập của các tham số này cần được điều chỉnh cẩn thận, nếu không có thể dẫn đến đánh giá sai tình trạng thị trường hoặc tạo tín hiệu sai. Đặc biệt là các ngưỡng quan trọng như ADX, tỷ lệ ATR và băng thông Brin cần được tối ưu hóa theo đặc điểm của các loại giao dịch khác nhau.
Độ phức tạp tính toánTính toán chỉ số và phán đoán logic nhiều tầng làm tăng sự phức tạp của chiến lược, có thể dẫn đến tốc độ phản hồi và thực hiện thực tế chậm, đặc biệt là trong môi trường giao dịch có chu kỳ thời gian thấp hoặc tần số cao.
Chuyển đổi thị trường chậm trễMặc dù các chiến lược được thiết kế để xác định các trạng thái thị trường khác nhau, quá trình chuyển đổi thị trường có thể không phải là tức thời, mà là dần dần. Trong quá trình chuyển đổi, chiến lược có thể có nguy cơ bị đánh giá sai và tín hiệu sai.
Sự phụ thuộc quá nhiều vào các chỉ số kỹ thuậtChiến lược này chủ yếu dựa trên các chỉ số kỹ thuật và hình thức giá, không xem xét các yếu tố cơ bản và cảm xúc của thị trường. Phân tích kỹ thuật thuần túy có thể không có hiệu lực khi có tin tức lớn hoặc sự kiện thiên bạch đen.
Phân tích sai lệchDo sự phức tạp và tự điều chỉnh của chiến lược, có nguy cơ quá phù hợp với dữ liệu lịch sử, thực tế có thể kém so với kết quả kiểm tra lại.
Nhu cầu vốnCác cơ chế quản lý rủi ro động có thể yêu cầu khoảng cách dừng lỗ lớn trong một số điều kiện thị trường, đòi hỏi đủ vốn giao dịch để duy trì tỷ lệ rủi ro hợp lý.
Tăng cường học máyCác phương pháp thực hiện có thể bao gồm sử dụng rừng ngẫu nhiên hoặc hỗ trợ máy vector để phân loại trạng thái thị trường, sử dụng trọng lượng chỉ số tối ưu hóa mạng thần kinh.
Chỉ số cảm xúc tích hợp: đưa ra các chỉ số cảm xúc thị trường (như VIX, tỷ lệ quyền chọn giảm giá / giảm giá, phân tích cảm xúc truyền thông xã hội, v.v.) như một lớp xác nhận bổ sung. Dữ liệu cảm xúc thị trường có thể được sử dụng như một chỉ số hàng đầu để giúp dự đoán điểm chuyển đổi thị trường.
Tích hợp dữ liệu cơ bảnPhát triển một khuôn khổ để tích hợp các dữ liệu cơ bản quan trọng như sự kiện lịch kinh tế, báo cáo thu nhập hoặc bản tin quan trọng. Điều này giúp điều chỉnh lỗ hổng rủi ro trước các thông báo quan trọng và tránh thiệt hại do biến động bất ngờ.
Bộ lọc thời gian: Thực hiện bộ lọc thời gian giao dịch, tránh thời gian có tính thanh khoản thấp hoặc biến động bất thường. Điều này đặc biệt quan trọng đối với giao dịch giữa các thị trường, có thể tránh các hành vi bất thường trong thời gian giao dịch giữa các thị trường châu Á, châu Âu và Mỹ.
Mô-đun phân tích liên quanThêm tính năng phân tích liên quan giữa các tài sản, xác định mô hình đa thị trường và tín hiệu phân tán. Ví dụ, liên quan giữa các cặp tiền tệ, mối quan hệ giữa chỉ số cổ phiếu và VIX có thể cung cấp xác nhận giao dịch bổ sung.
Tối ưu hóa quy mô nắm giữ độngTự động điều chỉnh quy mô vị trí dựa trên cơ chế thị trường hiện tại và hiệu suất lịch sử. Có thể tăng lỗ hổng rủi ro trong cơ chế thị trường hoạt động tốt và giảm rủi ro trong môi trường không chắc chắn hoặc kém hiệu suất lịch sử.
Tối ưu hóa phần cứng: Cải thiện hiệu quả mã, giảm độ phức tạp tính toán, đặc biệt là trong môi trường giao dịch trực tiếp. Bạn có thể xem xét viết lại một phần logic, sử dụng các thuật toán và cấu trúc dữ liệu hiệu quả hơn.
Chiến lược giao dịch định lượng theo cơ chế thị trường tự điều chỉnh khung thời gian đa đại diện cho một sự đổi mới quan trọng của hệ thống giao dịch định lượng, kết hợp nhận dạng cơ chế thị trường, phân tích khung thời gian đa, nhận dạng hình thức và quản lý rủi ro động. Khả năng tự điều chỉnh và tích hợp các chỉ số kỹ thuật toàn diện của nó cho phép nó duy trì khả năng cạnh tranh trong nhiều môi trường thị trường, chứ không chỉ giới hạn ở một trạng thái thị trường duy nhất.
Giá trị thực sự của chiến lược này nằm ở khung tổng thể chứ không phải là các thành phần riêng lẻ của nó. Bằng cách xác định cơ chế thị trường, xác nhận nhiều khung thời gian, nhận dạng hình dạng và quản lý rủi ro động, chiến lược có thể tạo ra tín hiệu chất lượng cao và quản lý rủi ro hiệu quả. Phương pháp đa tầng này làm giảm tín hiệu sai và cải thiện sức khỏe tổng thể.
Tuy nhiên, chiến lược này cũng phải đối mặt với những thách thức như độ nhạy cảm của các tham số, tính toán phức tạp và khả năng quá phù hợp. Các nhà giao dịch nên chú ý đến những rủi ro này khi áp dụng chiến lược này, thực hiện tối ưu hóa tham số đầy đủ và thử nghiệm về phía trước.
Các hướng tối ưu hóa trong tương lai bao gồm tăng cường học máy, tích hợp các chỉ số cảm xúc và điều chỉnh kích thước vị trí động. Những cải tiến này sẽ tiếp tục nâng cao khả năng thích ứng và ổn định của chiến lược, làm cho nó trở thành một hệ thống giao dịch toàn diện hơn.
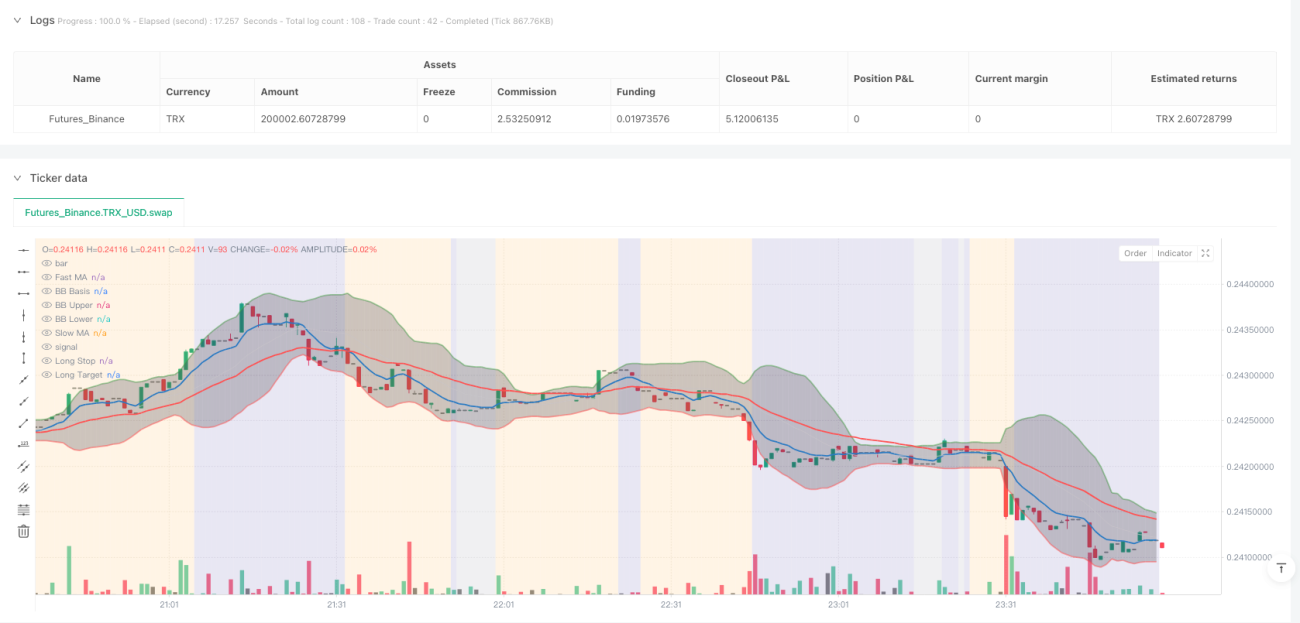
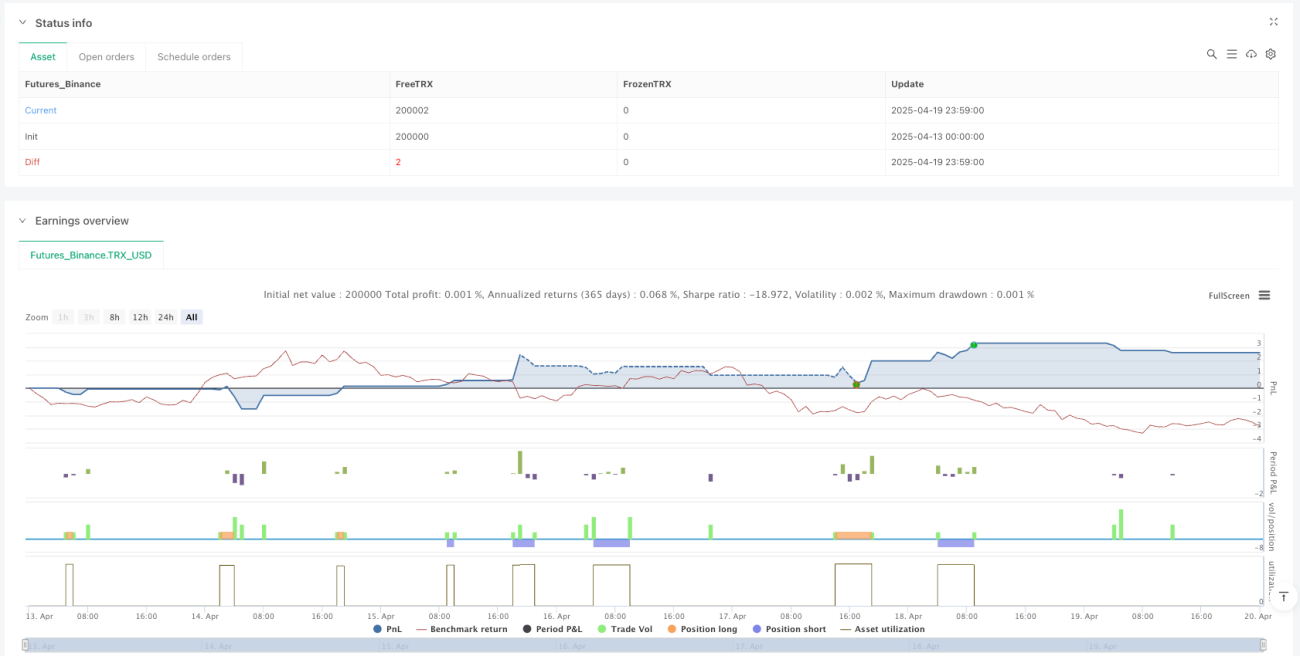
/*backtest
start: 2025-04-13 00:00:00
end: 2025-04-20 00:00:00
period: 1m
basePeriod: 1m
exchanges: [{"eid":"Futures_Binance","currency":"TRX_USD"}]
*/
//@version=6
strategy("Dskyz (DAFE) AI Adaptive Regime - Pro", overlay=true, default_qty_type=strategy.fixed, default_qty_value=1, calc_on_order_fills=true, calc_on_every_tick=true)
// This script uses higher timeframe values for RSI/MACD, integrated into regime detection and scoring.
// Logic uses closed HTF bars to avoid repainting.
// D=====================================================Z
// 1. ATR SETTINGS==Z
// D=====================================================Z
group_atr = "⚡ ATR Settings"
atr_period = input.int(14, "ATR Period", minval=1, group=group_atr)
atr_multiplier = input.float(1.5, "ATR Multiplier", minval=0.1, step=0.1, group=group_atr)
atr_val = ta.atr(atr_period)
atr_avg = ta.sma(atr_val, 50)
// D=====================================================Z
// 2. MOVING AVERAGE (MA) SETTINGS==Z
// D=====================================================Z
group_ma = "📊 Moving Averages"
fast_ma_length = input.int(9, "Fast MA Length", minval=1, group=group_ma)
slow_ma_length = input.int(34, "Slow MA Length", minval=1, group=group_ma)
ma_fast = ta.ema(close, fast_ma_length)
ma_slow = ta.ema(close, slow_ma_length)
ma_strength_threshold = input.float(0.5, "MA Strength Threshold", minval=0.0, step=0.1, group=group_ma)
trend_dir = ma_fast > ma_slow + (atr_val * ma_strength_threshold) ? 1 : ma_fast < ma_slow - (atr_val * ma_strength_threshold) ? -1 : 0
// D=====================================================Z
// 3. MULTI-TIMEFRAME (HTF) SETTINGS==Z
// D=====================================================Z
group_MTA = "⏱️ Multi-Timeframe Inputs"
htf = input.timeframe("D", "HTF for RSI & MACD", group=group_MTA)
htf_rsi_raw = request.security(syminfo.tickerid, htf, ta.rsi(close, 14))
htf_rsi = htf_rsi_raw[1]
[htf_macd_line_raw, htf_macd_signal_raw, htf_macd_hist_raw] = request.security(syminfo.tickerid, htf, ta.macd(close, 12, 26, 9))
htf_macd_line = htf_macd_line_raw[1]
htf_macd_signal = htf_macd_signal_raw[1]
htf_macd_hist = htf_macd_hist_raw[1]
// new: HTF trend direction for regime detection
htf_trend_bull = htf_macd_line > htf_macd_signal and htf_rsi > 50
htf_trend_bear = htf_macd_line < htf_macd_signal and htf_rsi < 50
// D=====================================================Z
// 4. TRADE SETTINGS==Z
// D=====================================================Z
group_trade = "⚙️ Trade Settings"
risk_per_trade = input.int(500, "Risk per Trade ($)", minval=50, group=group_trade)
max_contracts = input.int(5, "Max Contracts", minval=1, group=group_trade)
max_daily_drawdown = input.float(0.05, "Max Daily Drawdown (%)", minval=0.01, group=group_trade)
tick_value = input.float(12.5, "Tick Value ($)", minval=0.01, group=group_trade)
ticks_per_point = input.int(4, "Ticks per Point", minval=1, group=group_trade)
default_stop_points = input.float(8.0, "Default Stop (Points)", minval=0.25, group=group_trade)
// D=====================================================Z
// 5. ADVANCED INDICATOR CALCULATIONS==Z
// D=====================================================Z
// --- ADX Calculation ---Z
adx_len = 14
up = ta.change(high)
down = -ta.change(low)
plus_dm = na(up) ? na : (up > down and up > 0 ? up : 0)
minus_dm = na(down) ? na : (down > up and down > 0 ? down : 0)
trur = ta.rma(ta.tr, adx_len)
plus_di = 100 * ta.rma(plus_dm, adx_len) / trur
minus_di = 100 * ta.rma(minus_dm, adx_len) / trur
adx_val = 100 * ta.rma(math.abs(plus_di - minus_di) / (plus_di + minus_di), adx_len)
// --- Bollinger Bands Calculation ---Z
bb_basis = ta.sma(close, 20)
bb_dev = 2 * ta.stdev(close, 20)
bb_upper = bb_basis + bb_dev
bb_lower = bb_basis - bb_dev
bb_width = (bb_upper - bb_lower) / bb_basis
bb_width_avg = ta.sma(bb_width, 50)
// --- Price Action Range ---Z
price_range = ta.highest(high, 20) - ta.lowest(low, 20)
range_ratio = price_range / close
// D=====================================================Z
// 6. REGIME ASSIGNMENT & PATTERN RECOGNITION==Z
// D=====================================================Z
// Regime assignment with HTF influence and looser thresholds
is_trending = adx_val > 20 and math.abs(ma_fast - ma_slow) > atr_val * 0.3 and htf_trend_bull or htf_trend_bear // loosened ADX and MA thresholds, added HTF
is_range = adx_val < 25 and range_ratio < 0.03 and not htf_trend_bull and not htf_trend_bear // loosened ADX and range, HTF neutral
is_volatile = bb_width > bb_width_avg * 1.5 and atr_val > atr_avg * 1.2 and (htf_rsi > 70 or htf_rsi < 30) // loosened BB/ATR, added HTF overbought/oversold
is_quiet = bb_width < bb_width_avg * 0.8 and atr_val < atr_avg * 0.9 // loosened BB/ATR
regime = is_trending ? 1 : is_range ? 2 : is_volatile ? 3 : is_quiet ? 4 : 5
regime_name = regime == 1 ? "Trending" : regime == 2 ? "Range" : regime == 3 ? "Volatile" : regime == 4 ? "Quiet" : "Other"
// Pattern Recognition & Volume Confirmation-Z
vol_avg = ta.sma(volume, 20)
vol_spike = volume > vol_avg * 1.5
recent_low = ta.lowest(low, 20)
recent_high = ta.highest(high, 20)
is_near_support = low <= recent_low * 1.01
is_near_resistance = high >= recent_high * 0.99
bullish_engulfing = close[1] < open[1] and close > open and close > open[1] and open < close[1] and is_near_support and vol_spike
hammer = high - low > 3 * math.abs(open - close) and (close - low) / (0.001 + high - low) > 0.6 and is_near_support and vol_spike
morning_star = close[2] < open[2] and math.abs(close[1] - open[1]) < 0.2 * (high[1] - low[1]) and close > open and close > (open[2] + close[2]) / 2 and is_near_support and vol_spike
piercing = close[1] < open[1] and close > open and close > (open[1] + close[1]) / 2 and open < close[1] and is_near_support and vol_spike
double_bottom = low < low[1] and low[1] > low[2] and low[2] < low[3] and close > open and is_near_support and vol_spike
bearish_engulfing = close[1] > open[1] and close < open and close < open[1] and open > close[1] and is_near_resistance and vol_spike
shooting_star = high - low > 3 * math.abs(open - close) and (high - close) / (0.001 + high - low) > 0.6 and is_near_resistance and vol_spike
evening_star = close[2] > open[2] and math.abs(close[1] - open[1]) < 0.2 * (high[1] - low[1]) and close < open and close < (open[2] + close[2]) / 2 and is_near_resistance and vol_spike
dark_cloud = close[1] > open[1] and close < open and close < (open[1] + close[1]) / 2 and open > close[1] and is_near_resistance and vol_spike
double_top = high > high[1] and high[1] < high[2] and high[2] > high[3] and close < open and is_near_resistance and vol_spike
bull_signal = (bullish_engulfing ? 0.5 : 0.0) +
(hammer ? (regime == 2 ? 0.4 : 0.2) : 0.0) +
(morning_star ? 0.2 : 0.0) +
(piercing ? 0.2 : 0.0) +
(double_bottom ? (regime == 3 ? 0.3 : 0.15) : 0.0)
bear_signal = (bearish_engulfing ? 0.5 : 0.0) +
(shooting_star ? (regime == 2 ? 0.4 : 0.2) : 0.0) +
(evening_star ? 0.2 : 0.0) +
(dark_cloud ? 0.2 : 0.0) +
(double_top ? (regime == 3 ? 0.3 : 0.15) : 0.0)
// Multi-Factor Confirmation with HTF-Z
rsi_val = ta.rsi(close, 14)
[macd_line, macd_signal, macd_hist] = ta.macd(close, 12, 26, 9)
trend_bull = ma_fast > ma_slow
trend_bear = ma_fast < ma_slow
rsi_bull = rsi_val < 30
rsi_bear = rsi_val > 70
macd_bull = macd_line > macd_signal
macd_bear = macd_line < macd_signal
vol_expansion = atr_val > atr_avg * 1.2
// new: HTF confirmation for scoring
htf_bull_confirm = htf_trend_bull and htf_rsi < 70
htf_bear_confirm = htf_trend_bear and htf_rsi > 30
bull_score = bull_signal + (trend_bull ? 0.2 : 0) + (rsi_bull ? 0.15 : 0) + (macd_bull ? 0.15 : 0) + (vol_expansion ? 0.1 : 0) + (htf_bull_confirm ? 0.2 : 0)
bear_score = bear_signal + (trend_bear ? 0.2 : 0) + (rsi_bear ? 0.15 : 0) + (macd_bear ? 0.15 : 0) + (vol_expansion ? 0.1 : 0) + (htf_bear_confirm ? 0.2 : 0)
// D=====================================================Z
// 7. PERFORMANCE TRACKING & ADAPTIVE THRESHOLDS==Z
// D=====================================================Z
var float[] regime_pnl_long = array.new_float(5, 0)
var float[] regime_pnl_short = array.new_float(5, 0)
var int[] regime_win_long = array.new_int(5, 0)
var int[] regime_loss_long = array.new_int(5, 0)
var int[] regime_win_short = array.new_int(5, 0)
var int[] regime_loss_short = array.new_int(5, 0)
var int entry_regime = na
if barstate.isconfirmed and strategy.closedtrades > 0 and not na(entry_regime)
last_trade_profit = strategy.closedtrades.profit(strategy.closedtrades - 1)
last_trade_entry_id = strategy.closedtrades.entry_id(strategy.closedtrades - 1)
idx = entry_regime - 1
if last_trade_entry_id == "Long"
array.set(regime_pnl_long, idx, array.get(regime_pnl_long, idx) + last_trade_profit)
if last_trade_profit > 0
array.set(regime_win_long, idx, array.get(regime_win_long, idx) + 1)
else
array.set(regime_loss_long, idx, array.get(regime_loss_long, idx) + 1)
else if last_trade_entry_id == "Short"
array.set(regime_pnl_short, idx, array.get(regime_pnl_short, idx) + last_trade_profit)
if last_trade_profit > 0
array.set(regime_win_short, idx, array.get(regime_win_short, idx) + 1)
else
array.set(regime_loss_short, idx, array.get(regime_loss_short, idx) + 1)
entry_regime := na
// D=====================================================Z
// 8. DRAWDOWN & CIRCUIT BREAKER==Z
// D=====================================================Z
var float max_equity = strategy.equity
if strategy.equity > max_equity
max_equity := strategy.equity
daily_drawdown = (max_equity - strategy.equity) / max_equity
pause_trading = daily_drawdown > max_daily_drawdown
// D=====================================================Z
// 9. ENTRY & EXIT LOGIC WITH DYNAMIC STOPS & TRAILING STOPS=Z
// D=====================================================Z
swing_low = ta.lowest(low, 5)
swing_high = ta.highest(high, 5)
long_condition = bull_score >= 1.0 and not pause_trading
short_condition = bear_score >= 1.0 and not pause_trading
var float trail_stop_long = na
var float trail_stop_short = na
var float long_stop_price = na
var float long_limit_price = na
var float short_stop_price = na
var float short_limit_price = na
if long_condition and strategy.position_size <= 0
intended_stop = swing_low - atr_multiplier * atr_val
stop_distance_points = close - intended_stop
risk_per_contract = stop_distance_points * syminfo.pointvalue
contracts = math.floor(risk_per_trade / risk_per_contract)
contracts := contracts > 0 ? contracts : 1
contracts := math.min(contracts, max_contracts)
long_limit = close + stop_distance_points * 2
strategy.entry("Long", strategy.long, qty = contracts)
strategy.exit("Exit", from_entry = "Long", stop = intended_stop, limit = long_limit)
long_stop_price := intended_stop
long_limit_price := long_limit
trail_stop_long := intended_stop
entry_regime := regime
if short_condition and strategy.position_size >= 0
intended_stop = swing_high + atr_multiplier * atr_val
stop_distance_points = intended_stop - close
risk_per_contract = stop_distance_points * syminfo.pointvalue
contracts = math.floor(risk_per_trade / risk_per_contract)
contracts := contracts > 0 ? contracts : 1
contracts := math.min(contracts, max_contracts)
short_limit = close - stop_distance_points * 2
strategy.entry("Short", strategy.short, qty = contracts)
strategy.exit("Exit", from_entry = "Short", stop = intended_stop, limit = short_limit)
short_stop_price := intended_stop
short_limit_price := short_limit
trail_stop_short := intended_stop
entry_regime := regime
if strategy.position_size > 0
if close > long_limit_price * 0.5
trail_stop_long := math.max(trail_stop_long, close - atr_val * atr_multiplier)
strategy.exit("Long Trailing Stop", from_entry = "Long", stop = trail_stop_long)
if strategy.position_size < 0
if close < short_limit_price * 0.5
trail_stop_short := math.min(trail_stop_short, close + atr_val * atr_multiplier)
strategy.exit("Short Trailing Stop", from_entry = "Short", stop = trail_stop_short)
if strategy.position_size == 0
long_stop_price := na
long_limit_price := na
short_stop_price := na
short_limit_price := na
// D=====================================================Z
// 10. VISUALIZATION==Z
// D=====================================================Z
bgcolor(regime == 1 ? color.new(color.green, 85) :
regime == 2 ? color.new(color.orange, 85) :
regime == 3 ? color.new(color.red, 85) :
regime == 4 ? color.new(color.gray, 85) :
color.new(color.navy, 85))
plotshape(long_condition, style=shape.triangleup, location=location.belowbar, color=color.green, size=size.small, title="Long Signal")
plotshape(short_condition, style=shape.triangledown, location=location.abovebar, color=color.red, size=size.small, title="Short Signal")
plot(ma_fast, "Fast MA", color=color.new(color.blue, 0), linewidth=2)
plot(ma_slow, "Slow MA", color=color.new(color.red, 0), linewidth=2)
plot(strategy.position_size > 0 ? long_stop_price : na, "Long Stop", color=color.new(color.red, 0), style=plot.style_linebr)
plot(strategy.position_size > 0 ? long_limit_price : na, "Long Target", color=color.new(color.green, 0), style=plot.style_linebr)
plot(strategy.position_size < 0 ? short_stop_price : na, "Short Stop", color=color.new(color.red, 0), style=plot.style_linebr)
plot(strategy.position_size < 0 ? short_limit_price : na, "Short Target", color=color.new(color.green, 0), style=plot.style_linebr)
// D=====================================================Z
// 11. DASHBOARD: METRICS TABLE (Bottom-Left)=Z
// D=====================================================Z
var table dashboard = table.new(position.bottom_left, 2, 13, bgcolor=color.new(#000000, 29), border_color=color.rgb(80,80,80), border_width=1)
if barstate.islast
table.cell(dashboard, 0, 0, "⚡(DAFE) AI Adaptive Regime™", text_color=color.rgb(96,8,118), text_size=size.small)
modeStr = pause_trading ? "Paused" : "Active"
table.cell(dashboard, 0, 1, "Mode:", text_color=color.white, text_size=size.small)
table.cell(dashboard, 1, 1, modeStr, text_color=color.white, text_size=size.small)
trendText = trend_dir == 1 ? "Bullish" : trend_dir == -1 ? "Bearish" : "Neutral"
table.cell(dashboard, 0, 2, "Trend:", text_color=color.white, text_size=size.small)
table.cell(dashboard, 1, 2, trendText, text_color=trend_dir == 1 ? color.green : trend_dir == -1 ? color.red : color.gray, text_size=size.small)
table.cell(dashboard, 0, 3, "ATR:", text_color=color.white, text_size=size.small)
table.cell(dashboard, 1, 3, str.tostring(atr_val, "#.##"), text_color=color.white, text_size=size.small)
table.cell(dashboard, 0, 4, "ATR Avg:", text_color=color.white, text_size=size.small)
table.cell(dashboard, 1, 4, str.tostring(atr_avg, "#.##"), text_color=color.white, text_size=size.small)
table.cell(dashboard, 0, 5, "Volume Spike:", text_color=color.white, text_size=size.small)
table.cell(dashboard, 1, 5, vol_spike ? "YES" : "NO", text_color=vol_spike ? color.green : color.red, text_size=size.small)
table.cell(dashboard, 0, 6, "RSI:", text_color=color.white, text_size=size.small)
table.cell(dashboard, 1, 6, str.tostring(rsi_val, "#.##"), text_color=color.white, text_size=size.small)
rsiCondText = rsi_val < 30 ? "Oversold" : rsi_val > 70 ? "Overbought" : "Neutral"
table.cell(dashboard, 0, 7, "RSI Cond:", text_color=color.white, text_size=size.small)
table.cell(dashboard, 1, 7, rsiCondText, text_color=color.white, text_size=size.small)
table.cell(dashboard, 0, 8, "HTF RSI:", text_color=color.white, text_size=size.small)
table.cell(dashboard, 1, 8, str.tostring(htf_rsi, "#.##"), text_color=color.white, text_size=size.small)
htfTrendText = htf_trend_bull ? "Bullish" : htf_trend_bear ? "Bearish" : "Neutral"
table.cell(dashboard, 0, 9, "HTF Trend:", text_color=color.white, text_size=size.small)
table.cell(dashboard, 1, 9, htfTrendText, text_color=htf_trend_bull ? color.green : htf_trend_bear ? color.red : color.gray, text_size=size.small)
lastSignal = long_condition ? "Buy" : short_condition ? "Sell" : "None"
table.cell(dashboard, 0, 10, "Last Signal:", text_color=color.white, text_size=size.small)
table.cell(dashboard, 1, 10, lastSignal, text_color=long_condition ? color.green : short_condition ? color.red : color.white, text_size=size.small)
table.cell(dashboard, 0, 11, "Regime:", text_color=color.white, text_size=size.small)
table.cell(dashboard, 1, 11, regime_name, text_color=color.white, text_size=size.small)
table.cell(dashboard, 0, 12, "Bull Score:", text_color=color.white, text_size=size.small)
table.cell(dashboard, 1, 12, str.tostring(bull_score, "#.##"), text_color=color.white, text_size=size.small)
// D=====================================================Z
// REGIME CONDITIONS
// D=====================================================Z
var table debug_table = table.new(position.top_right, 2, 5, bgcolor=color.new(#000000, 50), border_color=color.rgb(80,80,80), border_width=1)
if barstate.islast
table.cell(debug_table, 0, 0, "Regime Conditions", text_color=color.rgb(96,8,118), text_size=size.small)
table.cell(debug_table, 0, 1, "ADX:", text_color=color.white, text_size=size.small)
table.cell(debug_table, 1, 1, str.tostring(adx_val, "#.##"), text_color=color.white, text_size=size.small)
table.cell(debug_table, 0, 2, "BB Width Ratio:", text_color=color.white, text_size=size.small)
table.cell(debug_table, 1, 2, str.tostring(bb_width / bb_width_avg, "#.##"), text_color=color.white, text_size=size.small)
table.cell(debug_table, 0, 3, "ATR Ratio:", text_color=color.white, text_size=size.small)
table.cell(debug_table, 1, 3, str.tostring(atr_val / atr_avg, "#.##"), text_color=color.white, text_size=size.small)
table.cell(debug_table, 0, 4, "Range Ratio:", text_color=color.white, text_size=size.small)
table.cell(debug_table, 1, 4, str.tostring(range_ratio, "#.##"), text_color=color.white, text_size=size.small)
// --- Bollinger Bands Visuals ---Z
p_bb_basis = plot(bb_basis, title="BB Basis", color=color.new(#ffffff, 50), linewidth=1)
p_bb_upper = plot(bb_upper, title="BB Upper", color=color.new(#4caf4f, 45), linewidth=2)
p_bb_lower = plot(bb_lower, title="BB Lower", color=color.new(#ff5252, 45), linewidth=2)
fill(p_bb_upper, p_bb_lower, color=color.new(#423645, 65))
//D=================================================================Z
// DASHBOARD: WATERMARK LOGO (Bottom-Right)
//D=================================================================Z
var table watermarkTable = table.new(position.bottom_right, 1, 1, bgcolor=color.rgb(0,0,0,80), border_color=color.rgb(0,50,137), border_width=1)
if barstate.islast
table.cell(watermarkTable, 0, 0, "⚡ Dskyz (DAFE) AI Adaptive Regime - Pro", text_color=color.rgb(96,8,118), text_size=size.normal)
// --- ALERTS ---Z
alertcondition(long_condition, title="Long Signal Alert", message="Enhanced Strategy Long Signal")
alertcondition(short_condition, title="Short Signal Alert", message="Enhanced Strategy Short Signal")