Hệ thống chiến lược giao dịch phòng ngừa và theo dõi xu hướng Fibonacci đa cấp

EMA ATR ADX DMI FIBONACCI SUPPORT RESISTANCE HEDGE VOLUME
Ngày tạo: 2025-05-26 13:15:16 sửa đổi lần cuối: 2025-08-20 15:52:36
sao chép: 0 Số nhấp chuột: 339
2
tập trung vào
319
Người theo dõi

Hệ thống chiến lược giao dịch phòng ngừa và theo dõi xu hướng Fibonacci đa cấp Hệ thống chiến lược giao dịch phòng ngừa và theo dõi xu hướng Fibonacci đa cấp

[tran]

Tổng quan

Hệ thống chiến lược giao dịch theo dõi xu hướng Fibonacci đa tầng là một chiến lược giao dịch định lượng toàn diện tích hợp nhiều chỉ số phân tích kỹ thuật. Chiến lược này dựa trên lý thuyết rút lui Fibonacci, kết hợp nhiều chỉ số kỹ thuật như chỉ số trung bình di chuyển (EMA), trung bình sóng thực (ATR), chỉ số xu hướng trung bình (ADX) và chỉ số di chuyển theo hướng (DMI) để xây dựng một khuôn khổ phân tích thị trường đa chiều.

Điều đặc biệt của chiến lược này là hệ thống quản lý rủi ro nhiều cấp và mô hình giao dịch linh hoạt. Bằng cách thiết lập nhiều mục tiêu dừng ((TP1 và TP2) và cơ chế dừng lỗ động dựa trên ATR, chiến lược có thể tối đa hóa tiềm năng thu nhập trong khi bảo vệ vốn. Ngoài ra, chức năng bảo vệ được tích hợp trong chiến lược tăng thêm độ đệm rủi ro, cho phép nó duy trì hiệu suất tương đối ổn định trong môi trường thị trường biến động.

Nguyên tắc chiến lược

Lý luận cốt lõi của chiến lược dựa trên sự kết hợp giữa lý thuyết Fibonacci Reversal và phân tích xu hướng. Đầu tiên, chiến lược xác định mức Fibonacci Reversal bằng cách tính toán các điểm cao nhất và thấp nhất trong một chu kỳ nhất định, bao gồm các vị trí quan trọng như 23,6%, 38,2%, 50%, 61,8%, 78,6%, 100% và 161,8%. Các mức này được sử dụng như là các mức hỗ trợ và kháng cự quan trọng, cung cấp tài liệu tham khảo quan trọng cho việc tạo tín hiệu giao dịch.

Trong lĩnh vực nhận dạng xu hướng, chiến lược sử dụng chỉ số di chuyển trung bình 50 kỳ làm công cụ đánh giá xu hướng chính. Khi giá nằm trên ba đường K liên tiếp trên EMA, nó được xác định là xu hướng tăng; ngược lại là xu hướng giảm. Đồng thời, chiến lược cũng phân tích cấu trúc giá, xác nhận cấu trúc đa đầu bằng cách nhận dạng các mức thấp cao hơn và các mức cao cao hơn, xác nhận cấu trúc đầu trống bằng các mức cao thấp hơn và các mức thấp hơn.

Việc giới thiệu các chỉ số ADX và DMI đã tăng cường độ chính xác trong việc đánh giá cường độ của xu hướng. Giá trị ADX lớn hơn 20 được coi là tiêu chuẩn cho xu hướng mạnh, trong khi sức mạnh tương đối của +DI và -DI được sử dụng để xác định định hướng của xu hướng. Phân tích khối lượng giao dịch cũng là một phần quan trọng của chiến lược, được coi là xác nhận khối lượng hiệu quả khi khối lượng giao dịch vượt quá 1,2 lần so với trung bình 20 kỳ.

Việc tạo ra tín hiệu giao dịch cần phải đáp ứng một số điều kiện đồng thời: hướng xu hướng rõ ràng, giá gần mức Fibonacci quan trọng, cường độ xu hướng đầy đủ, xác nhận chỉ số định hướng và tăng khối lượng giao dịch. Cơ chế lọc đa dạng này làm tăng đáng kể độ tin cậy của tín hiệu và giảm khả năng có tín hiệu giả.

Lợi thế chiến lược

Chiến lược này có nhiều ưu điểm đáng kể, đầu tiên được thể hiện trong khung phân tích kỹ thuật tổng hợp của nó. Bằng cách tích hợp lý thuyết Fibonacci, phân tích xu hướng, chỉ số động lực và phân tích khối lượng giao dịch, chiến lược có thể đánh giá tình hình thị trường từ nhiều chiều, cung cấp tín hiệu giao dịch toàn diện và chính xác hơn. Phương pháp kết hợp nhiều chỉ số này có hiệu quả làm giảm tín hiệu sai lệch mà một chỉ số duy nhất có thể tạo ra, tăng sự ổn định và độ tin cậy của chiến lược tổng thể.

Hệ thống quản lý rủi ro của chiến lược là một lợi thế lớn khác của nó. Cơ chế ngăn chặn kép cho phép thương nhân khóa một phần lợi nhuận khi đạt được mục tiêu đầu tiên, trong khi giữ vị trí còn lại để theo đuổi lợi nhuận lớn hơn. Cài đặt dừng lỗ động dựa trên ATR có thể tự động điều chỉnh mức độ kiểm soát rủi ro theo biến động của thị trường, vừa có thể thắt chặt dừng để bảo vệ lợi nhuận khi dao động thấp, vừa có thể nới lỏng dừng để tránh bị rung chuyển bình thường khi dao động cao.

Tính năng giao dịch đảo ngược làm tăng cơ hội lợi nhuận cho chiến lược. Khi giá tăng trở lại mức hỗ trợ hoặc kháng cự quan trọng, chiến lược có thể nhanh chóng nhận ra và tham gia vào tình trạng đảo ngược ngắn hạn này, từ đó tăng thêm cơ hội giao dịch dựa trên giao dịch xu hướng. Tính linh hoạt này cho phép chiến lược thích nghi với các điều kiện thị trường khác nhau, cho dù là thị trường xu hướng mạnh hay thị trường xung đột khu vực để tìm cơ hội giao dịch phù hợp.

Việc tích hợp các tính năng bảo hiểm là một tính năng sáng tạo của chiến lược. Khi nắm giữ nhiều vị trí đầu, chiến lược sẽ mở vị trí đầu trống nếu có tín hiệu đầu trống; và ngược lại. Cơ chế này có thể cung cấp bảo vệ bổ sung khi thị trường quay lưng nhanh, giảm tổn thất tiềm ẩn và có thể chuyển thành cơ hội kiếm lợi nhuận mới.

Việc thiết lập bộ lọc thời gian đã ngăn chặn các vấn đề giao dịch quá mức. Bằng cách yêu cầu có ít nhất 5 đường K giữa các tín hiệu liên tiếp, chiến lược này tránh việc mở các vị trí thường xuyên trong thời gian ngắn, giảm chi phí giao dịch và cải thiện chất lượng tín hiệu.

Rủi ro chiến lược

Mặc dù có nhiều lợi thế, chiến lược này vẫn có một số yếu tố rủi ro cần chú ý. Đầu tiên là rủi ro phụ thuộc vào tham số. Chiến lược liên quan đến nhiều cài đặt tham số, bao gồm chu kỳ Fibonacci, độ khoan dung, nhân ATR, v.v., sự lựa chọn các tham số này có ảnh hưởng quan trọng đến hiệu suất của chiến lược.

Tính thích ứng với môi trường thị trường là một rủi ro tiềm ẩn khác. Chiến lược được dựa trên phân tích kỹ thuật chủ yếu, có thể hoạt động không tốt trong một số điều kiện thị trường, ví dụ như chỉ số kỹ thuật có thể thất bại trong các hành động đơn phương mạnh mẽ do cơ bản thúc đẩy. Ngoài ra, cả tần suất và độ chính xác của chiến lược có thể bị ảnh hưởng trong môi trường thị trường có biến động rất thấp hoặc rất cao.

Điểm trượt và rủi ro thực hiện cũng cần được xem xét. Trong giao dịch thực tế, đặc biệt là trong điều kiện thị trường có nhiều biến động, có thể có sự khác biệt giữa giá thực hiện lệnh và giá mong đợi. Chi phí trượt này có thể làm xói mòn lợi nhuận lý thuyết của chiến lược, đặc biệt là đối với chiến lược giao dịch thường xuyên.

Chức năng bảo hiểm, mặc dù cung cấp sự bảo vệ bổ sung, nhưng cũng làm tăng sự phức tạp của chiến lược. Trong một số trường hợp, các hoạt động bảo hiểm có thể dẫn đến mất mát đồng thời của các vị trí trống, hoặc gây ra chi phí bổ sung về phí xử lý. Do đó, cần thận trọng đánh giá hiệu quả thực tế của chức năng bảo hiểm và xem xét việc kích hoạt tính năng này trong các điều kiện thị trường cụ thể.

Hướng tối ưu hóa chiến lược

Để nâng cao hơn nữa hiệu suất chiến lược, có thể tối ưu hóa từ nhiều hướng. Đầu tiên là việc giới thiệu cơ chế điều chỉnh tham số động. Các tham số quan trọng như chu kỳ Fibonacci, ATR nhân có thể được điều chỉnh động theo các yếu tố như biến động thị trường, cường độ xu hướng. Ví dụ: tăng ATR nhân trong thị trường biến động cao để cung cấp không gian dừng lớn hơn, giảm ATR nhân trong thị trường biến động thấp để thắt chặt kiểm soát rủi ro.

Việc tích hợp các kỹ thuật học máy là một hướng tối ưu hóa quan trọng khác. Các thuật toán học máy có thể được sử dụng để xác định thời điểm nhập cảnh tốt nhất hoặc cấu hình tối ưu dựa trên các tham số học tập dựa trên dữ liệu lịch sử. Ngoài ra, các kỹ thuật xử lý ngôn ngữ tự nhiên cũng có thể được sử dụng để phân tích cảm xúc thị trường và sự kiện tin tức ảnh hưởng đến giá cả, thêm chiều phân tích cơ bản cho chiến lược.

Việc tích hợp phân tích nhiều khung thời gian có thể cung cấp một cái nhìn toàn diện hơn về thị trường. Có thể xác định hướng xu hướng lớn trên khung thời gian dài hơn, tìm kiếm điểm vào chính xác trên khung thời gian ngắn hơn.

Tối ưu hóa quản lý tiền bạc cũng là một cách quan trọng để nâng cao hiệu suất chiến lược. Bạn có thể điều chỉnh kích thước vị trí theo động theo các yếu tố như điều kiện thị trường, độ tin tưởng của chiến lược. Ví dụ: tăng vị trí khi có tín hiệu độ tin cậy cao và giảm vị trí khi có tín hiệu độ tin cậy thấp. Ngoài ra, bạn cũng có thể giới thiệu cơ chế kiểm soát rút lui tối đa, tự động giảm vị trí hoặc tạm dừng giao dịch khi chiến lược có tổn thất lớn.

Các chi tiết thêm về logic dừng lỗ dừng cũng đáng xem xét. Có thể giới thiệu cơ chế theo dõi dừng lỗ, điều chỉnh vị trí dừng lỗ theo động thái biến động của giá để khóa nhiều lợi nhuận hơn. Đồng thời, có thể đặt mục tiêu dừng thông minh hơn dựa trên các đặc điểm cấu trúc thị trường, chẳng hạn như dừng sớm ở gần điểm kháng cự quan trọng.

Tóm tắt

Hệ thống chiến lược giao dịch theo dõi xu hướng Fibonacci đa tầng đại diện cho một hướng phát triển quan trọng trong công nghệ giao dịch định lượng hiện đại. Chiến lược này xây dựng một khung giao dịch mạnh mẽ và linh hoạt bằng cách tích hợp khéo léo nhiều công cụ phân tích kỹ thuật cổ điển. Cơ chế lọc đa tầng của nó đảm bảo chất lượng tín hiệu, hệ thống quản lý rủi ro đa tầng cung cấp sự bảo vệ vốn hiệu quả, trong khi chức năng bảo hiểm tăng thêm biên độ an toàn cho chiến lược.

Việc thực hiện chiến lược thành công đòi hỏi sự hiểu biết đầy đủ về các nguyên tắc cơ bản và cơ chế hoạt động của chiến lược và điều chỉnh và tối ưu hóa các tham số thích hợp theo môi trường giao dịch cụ thể. Mặc dù chiến lược này được thiết kế tốt về mặt lý thuyết, nhưng trong ứng dụng thực tế, vẫn cần xem xét tác động của các yếu tố thực tế như cấu trúc vi mô của thị trường, chi phí giao dịch và điểm trượt.

Với sự phát triển liên tục của công nghệ trí tuệ nhân tạo và học máy, chiến lược này có rất nhiều không gian để tối ưu hóa. Hiệu suất của chiến lược có thể được nâng cao hơn nữa bằng cách giới thiệu các công nghệ phân tích dữ liệu tiên tiến hơn và cơ chế thích ứng. Đối với các nhà giao dịch định lượng, các chiến lược tổng hợp như vậy cung cấp một nền tảng học tập và cải tiến quý giá, giúp hiểu sâu hơn về động lực thị trường và tầm quan trọng của quản lý rủi ro. ||
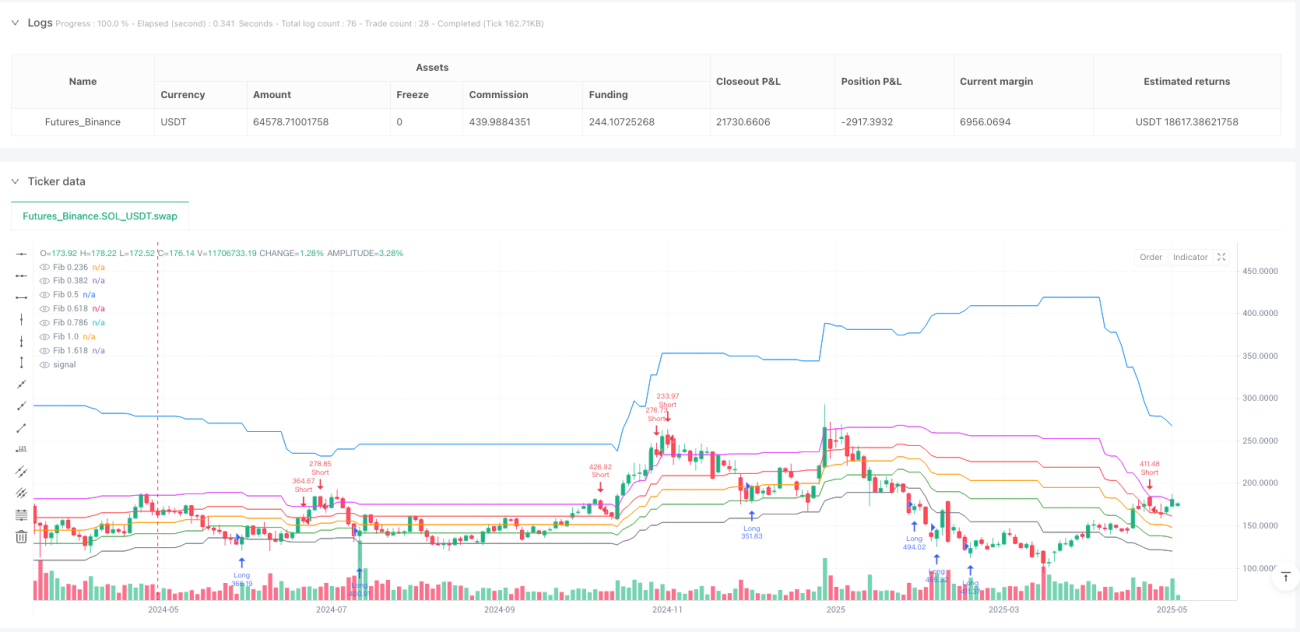
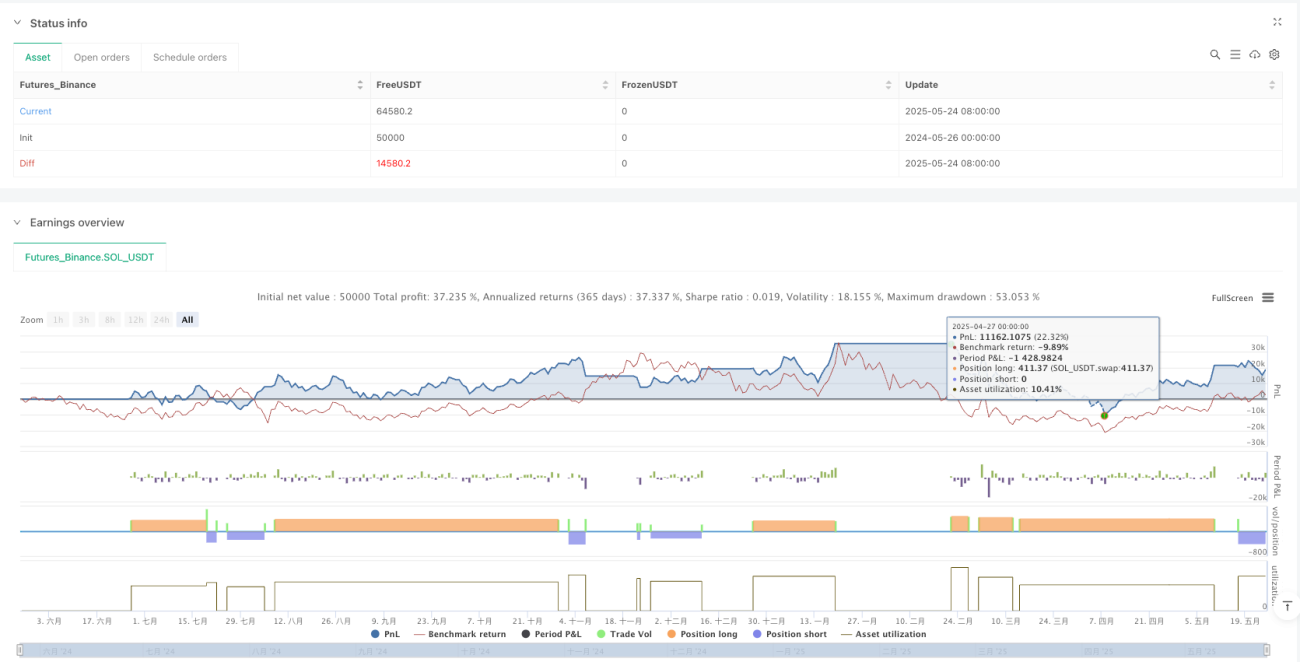
Overview

The Multi-Level Fibonacci Trend Following and Hedging Trading Strategy System is a comprehensive quantitative trading strategy that integrates multiple technical analysis indicators. This strategy centers on Fibonacci retracement theory, combining Exponential Moving Average (EMA), Average True Range (ATR), Average Directional Index (ADX), and Directional Movement Indicator (DMI) to construct a multi-dimensional market analysis framework. The strategy not only features traditional trend-following capabilities but also integrates bounce trading mechanisms and hedging functionality, aiming to capture profitable opportunities under different market conditions while effectively controlling risk.

The unique aspect of this strategy lies in its multi-layered risk management system and flexible trading modes. By setting multiple take-profit targets (TP1 and TP2) and dynamic stop-loss mechanisms based on ATR, the strategy can maximize profit potential while protecting capital. Additionally, the built-in hedging function adds an extra risk buffer to the strategy, enabling it to maintain relatively stable performance even in highly volatile market environments.

Strategy Principles

The core logic of the strategy is based on the combination of Fibonacci retracement theory and trend analysis. First, the strategy calculates the highest and lowest points within a specified period to determine Fibonacci retracement levels, including key positions at 23.6%, 38.2%, 50%, 61.8%, 78.6%, 100%, and 161.8%. These levels serve as important support and resistance zones, providing crucial references for trading signal generation.

For trend identification, the strategy employs a 50-period Exponential Moving Average as the primary trend determination tool. When prices remain above the EMA for three consecutive candlesticks, it’s identified as an uptrend; conversely, it’s considered a downtrend. Simultaneously, the strategy analyzes price structure by identifying higher lows and higher highs to confirm bullish structure, and lower highs and lower lows to confirm bearish structure.

The introduction of ADX and DMI indicators enhances the precision of trend strength assessment. An ADX value greater than 20 is considered the standard for a strong trend, while the relative strength of +DI and -DI is used to determine trend direction. Volume analysis is also an important component of the strategy, where volume exceeding 1.2 times the 20-period average is considered effective volume confirmation.

Trade signal generation requires multiple conditions to be met simultaneously: clear trend direction, price proximity to key Fibonacci levels, sufficient trend strength, directional indicator confirmation, and volume expansion. This multi-filter mechanism significantly improves signal reliability and reduces the probability of false signals.

Strategy Advantages

This strategy possesses multiple significant advantages, first manifested in its comprehensive technical analysis framework. By integrating Fibonacci theory, trend analysis, momentum indicators, and volume analysis, the strategy can evaluate market conditions from multiple dimensions, providing more comprehensive and accurate trading signals. This multi-indicator fusion approach effectively reduces misleading signals that might be generated by single indicators, improving the overall stability and reliability of the strategy.

The strategy’s risk management system represents another major advantage. The dual take-profit mechanism allows traders to lock in partial profits upon reaching the first target while maintaining remaining positions to pursue greater returns. ATR-based dynamic stop-loss settings can automatically adjust risk control levels according to market volatility, tightening stops during low volatility to protect profits and relaxing stops during high volatility to avoid being stopped out by normal fluctuations.

The bounce trading functionality adds additional profit opportunities to the strategy. When prices bounce at key support or resistance levels, the strategy can quickly identify and participate in such short-term reversal movements, thereby adding more trading opportunities beyond trend trading. This flexibility enables the strategy to adapt to different market conditions, finding suitable trading opportunities whether in strong trending markets or range-bound markets.

The integration of hedging functionality is an innovative feature of this strategy. When holding long positions and a short signal appears, the strategy will open a hedge short position; vice versa. This mechanism can provide additional protection during rapid market reversals, reducing potential losses and possibly converting them into new profit opportunities.

The time filter setting prevents overtrading issues. By requiring at least 5 candlesticks between consecutive signals, the strategy avoids frequent position opening within short periods, reducing trading costs and improving signal quality.

Strategy Risks

Despite the strategy’s multiple advantages, several risk factors require attention. First is parameter dependency risk. The strategy involves multiple parameter settings, including Fibonacci period, tolerance, ATR multipliers, etc. The selection of these parameters significantly impacts strategy performance. Inappropriate parameter settings may lead to overfitting historical data or poor performance in actual markets. Therefore, sufficient backtesting and parameter optimization are needed to find the most suitable parameter combinations for specific markets and timeframes.

Market environment adaptability represents another potential risk. The strategy is primarily based on technical analysis and may underperform in certain market conditions, such as during fundamental-driven strong unidirectional moves where technical indicators might fail. Additionally, in extremely low or high volatility market environments, both signal generation frequency and accuracy may be affected.

Slippage and execution risks also need consideration. In actual trading, particularly during high volatility market conditions, there may be differences between order execution prices and expected prices. This slippage cost could erode the strategy’s theoretical returns, especially for frequently trading strategies.

While the hedging function provides additional protection, it also increases strategy complexity. In certain situations, hedging operations might result in simultaneous losses on both long and short positions, or generate additional costs in terms of commissions. Therefore, careful evaluation of the hedging function’s actual effectiveness is needed, along with consideration of whether to enable this function under specific market conditions.

Strategy Optimization Directions

To further enhance strategy performance, optimization can be pursued in multiple directions. First is the introduction of dynamic parameter adjustment mechanisms. Key parameters such as Fibonacci period and ATR multipliers can be dynamically adjusted based on market volatility, trend strength, and other factors. For example, increasing ATR multipliers in high volatility markets to provide larger stop-loss space, and decreasing ATR multipliers in low volatility markets to tighten risk control.

Integration of machine learning technology represents another important optimization direction. Machine learning algorithms can be used to identify optimal entry timing or learn optimal parameter combination configurations based on historical data. Additionally, natural language processing technology can be utilized to analyze market sentiment and news event impacts on prices, adding fundamental analysis dimensions to the strategy.

Integration of multi-timeframe analysis can provide a more comprehensive market perspective. Larger timeframes can be used to confirm major trend direction, while shorter timeframes can be used to find precise entry points. This coordinated multi-timeframe analysis can improve signal quality and reduce counter-trend trading risks.

Money management optimization is also an important avenue for enhancing strategy performance. Position sizes can be dynamically adjusted based on market conditions, strategy confidence levels, and other factors. For example, increasing positions during high-confidence signals and reducing positions during low-confidence signals. Additionally, maximum drawdown control mechanisms can be introduced to automatically reduce positions or pause trading when the strategy experiences significant losses.

Further refinement of take-profit and stop-loss logic is also worth considering. Trailing stop mechanisms can be introduced to dynamically adjust stop-loss positions based on price movements to lock in more profits. Simultaneously, more intelligent take-profit targets can be set based on market structure characteristics, such as taking profits early near key resistance levels.

Conclusion

The Multi-Level Fibonacci Trend Following and Hedging Trading Strategy System represents an important development direction in modern quantitative trading technology. This strategy cleverly integrates multiple classic technical analysis tools to construct a trading framework that is both robust and flexible. Its multi-filter mechanism ensures signal quality, the multi-layered risk management system provides effective capital protection, and the hedging function adds an additional safety margin to the strategy.

Successful implementation of this strategy requires thorough understanding of its fundamental principles and operational mechanisms, along with appropriate parameter adjustments and optimizations based on specific trading environments. While the strategy has excellent theoretical design, practical application still requires consideration of real-world factors such as market microstructure, trading costs, and slippage.

With the continuous development of artificial intelligence and machine learning technologies, this strategy still has enormous optimization potential. Through the introduction of more advanced data analysis techniques and adaptive mechanisms, strategy performance is expected to be further enhanced. For quantitative traders, such comprehensive strategies provide a valuable learning and improvement platform, helping to deepen understanding of market dynamics and the importance of risk management.[/trans]

Mã nguồn chiến lược
/*backtest
start: 2024-05-26 00:00:00
end: 2025-05-25 00:00:00
period: 2d
basePeriod: 2d
exchanges: [{"eid":"Futures_Binance","currency":"SOL_USDT"}]
*/

//@version=5
strategy("Fibonacci Trend v6.4 - TP/SL Labels", overlay=true, default_qty_type=strategy.percent_of_equity, default_qty_value=100)

// === Parameters ===
fibLen     = input.int(50, "Fibonacci Range")
fibTol     = input.float(0.01, "Fib Proximity Tolerance (%)", step=0.001)
slMult     = input.float(1.5, "SL - ATR", step=0.1)
tp2Mult    = input.float(2.0, "TP2 - ATR", step=0.1)
srLookback = input.int(20, "Support/Resistance Lookback Bars")
useBounce  = input.bool(true, "Enable Bounce Entry")

// === Indicators ===
ema50   = ta.ema(close, 50)
atr     = ta.atr(14)
volAvg  = ta.sma(volume, 20)
volHigh = volume > volAvg * 1.2

// === Fibonacci Levels ===
lowWick   = ta.lowest(low, fibLen)
highWick  = ta.highest(high, fibLen)
rangeWick = highWick - lowWick

fib236  = lowWick + 0.236 * rangeWick
fib382  = lowWick + 0.382 * rangeWick
fib5    = lowWick + 0.5   * rangeWick
fib618  = lowWick + 0.618 * rangeWick
fib786  = lowWick + 0.786 * rangeWick
fib1    = highWick
fib1618 = lowWick + 1.618 * rangeWick

nearSupport = math.abs(low - fib382)/close < fibTol or math.abs(low - fib5)/close < fibTol
nearResist  = math.abs(high - fib618)/close < fibTol

// === Trend Structure ===
higherLow   = low > low[1] and low[1] > low[2]
higherHigh  = high > high[1]
lowerHigh   = high < high[1] and high[1] < high[2]
lowerLow    = low < low[1]
longStruct  = higherLow and higherHigh
shortStruct = lowerHigh and lowerLow

// === ADX / DMI ===
dmiLen   = 14
upMove   = high - high[1]
downMove = low[1] - low
plusDM   = (upMove > downMove and upMove > 0) ? upMove : 0
minusDM  = (downMove > upMove and downMove > 0) ? downMove : 0
tr       = ta.tr(true)
tr14     = ta.rma(tr, dmiLen)
plusDI   = 100 * ta.rma(plusDM, dmiLen) / tr14
minusDI  = 100 * ta.rma(minusDM, dmiLen) / tr14
dx       = 100 * math.abs(plusDI - minusDI) / (plusDI + minusDI)
adx      = ta.rma(dx, dmiLen)
trendStrong = adx > 20

// === EMA Momentum Break ===
emaBreakLong  = close > ema50 and close[1] < ema50 and volume > volAvg
emaBreakShort = close < ema50 and close[1] > ema50 and volume > volAvg

// === Time Filter ===
var int lastLongBar = na
var int lastShortBar = na
canLong  = na(lastLongBar) or (bar_index - lastLongBar > 5)
canShort = na(lastShortBar) or (bar_index - lastShortBar > 5)

priceAboveEMA = close > ema50 and close[1] > ema50 and close[2] > ema50
priceBelowEMA = close < ema50 and close[1] < ema50 and close[2] < ema50

// === Support / Resistance ===
support = ta.lowest(low, srLookback)
resist  = ta.highest(high, srLookback)

// === Entry Conditions ===
longTrend  = priceAboveEMA and nearSupport and trendStrong and plusDI > minusDI and longStruct and (volHigh or emaBreakLong) and canLong
shortTrend = priceBelowEMA and nearResist  and trendStrong and minusDI > plusDI and shortStruct and (volHigh or emaBreakShort) and canShort

bounceLong  = useBounce and math.abs(low - support)/close < fibTol and close > open and close > close[1]
bounceShort = useBounce and math.abs(high - resist)/close < fibTol and close < open and close < close[1]

longSignal  = longTrend or bounceLong
shortSignal = shortTrend or bounceShort

// === TP/SL Calculations ===
tp1Long  = resist
tp2Long  = close + atr * tp2Mult
slLong   = close - atr * slMult

tp1Short = support
tp2Short = close - atr * tp2Mult
slShort  = close + atr * slMult

tp1ColorLong  = bounceLong  ? color.blue : color.yellow
tp1ColorShort = bounceShort ? color.blue : color.yellow

// === Long Entry ===
if (longSignal and strategy.position_size <= 0)
    strategy.entry("Long", strategy.long)
    strategy.exit("TP1", from_entry="Long", limit=tp1Long, stop=slLong, qty_percent=50)
    strategy.exit("TP2", from_entry="Long", limit=tp2Long, stop=slLong)
    lastLongBar := bar_index
    label.new(bar_index, close, text="ENTRY: " + str.tostring(close, "#.##"), style=label.style_label_down, color=color.green, textcolor=color.white)
    label.new(bar_index, tp1Long, text="TP1: " + str.tostring(tp1Long, "#.##"), style=label.style_label_down, color=tp1ColorLong)
    label.new(bar_index, tp2Long, text="TP2: " + str.tostring(tp2Long, "#.##"), style=label.style_label_down, color=color.green)
    label.new(bar_index, slLong,  text="SL: "  + str.tostring(slLong, "#.##"),  style=label.style_label_up, color=color.red)

// === Short Entry ===
if (shortSignal and strategy.position_size >= 0)
    strategy.entry("Short", strategy.short)
    strategy.exit("TP1", from_entry="Short", limit=tp1Short, stop=slShort, qty_percent=50)
    strategy.exit("TP2", from_entry="Short", limit=tp2Short, stop=slShort)
    lastShortBar := bar_index
    label.new(bar_index, close, text="ENTRY: " + str.tostring(close, "#.##"), style=label.style_label_up, color=color.red, textcolor=color.white)
    label.new(bar_index, tp1Short, text="TP1: " + str.tostring(tp1Short, "#.##"), style=label.style_label_up, color=tp1ColorShort)
    label.new(bar_index, tp2Short, text="TP2: " + str.tostring(tp2Short, "#.##"), style=label.style_label_up, color=color.green)
    label.new(bar_index, slShort,  text="SL: "  + str.tostring(slShort, "#.##"),  style=label.style_label_down, color=color.red)

// === Hedge Orders ===
if (strategy.position_size > 0 and shortSignal)
    strategy.entry("HedgeShort", strategy.short)

if (strategy.position_size < 0 and longSignal)
    strategy.entry("HedgeLong", strategy.long)

// === Fibonacci Plotting ===
plot(fib236,  "Fib 0.236",  color=color.gray)
plot(fib382,  "Fib 0.382",  color=color.green)
plot(fib5,    "Fib 0.5",    color=color.orange)
plot(fib618,  "Fib 0.618",  color=color.red)
plot(fib786,  "Fib 0.786",  color=color.fuchsia)
plot(fib1,    "Fib 1.0",    color=color.white)
plot(fib1618, "Fib 1.618",  color=color.blue)