Chiến lược phá vỡ SMA Engulfing

SMA ENGULFING ATR TRAILING
Ngày tạo: 2025-09-04 13:40:53 sửa đổi lần cuối: 2025-09-04 13:40:53
sao chép: 1 Số nhấp chuột: 233
2
tập trung vào
319
Người theo dõi

Chiến lược phá vỡ SMA Engulfing Chiến lược phá vỡ SMA Engulfing

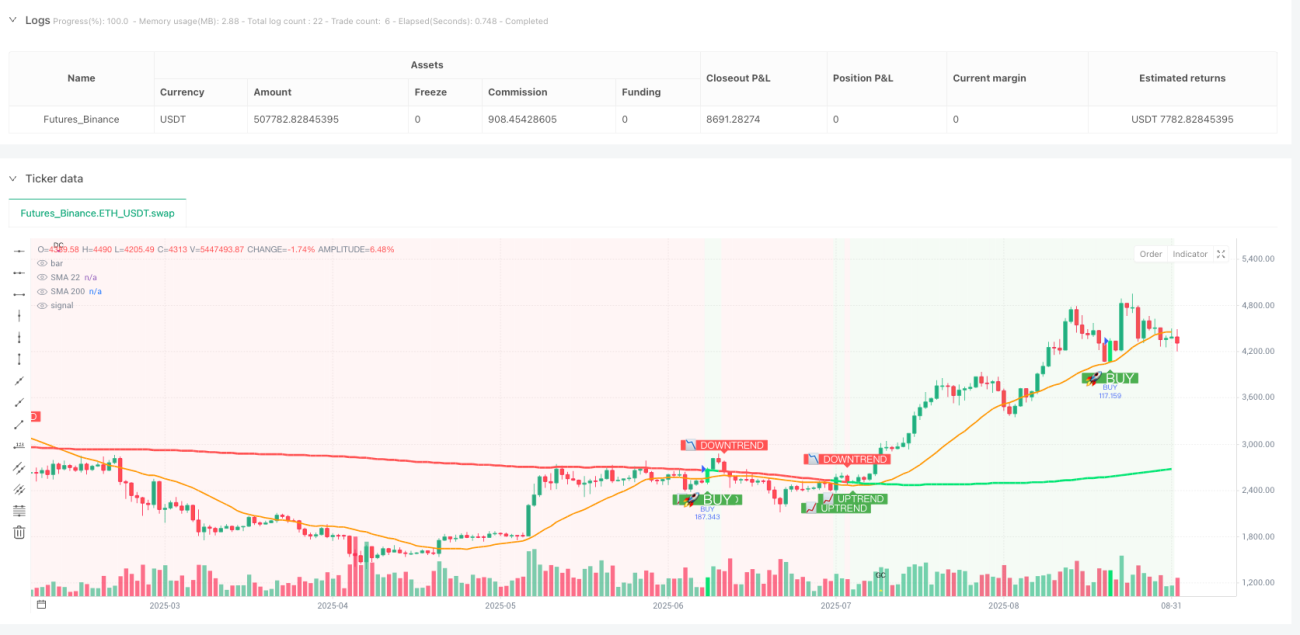
Đây không phải là một chiến lược tiêu thụ hình dạng thông thường, mà là một hệ thống bắn tỉa chính xác với bộ lọc ba lần.

Không còn sử dụng các chiến lược rác của tín hiệu đơn nữa. SHUBHAM V7a đã kết hợp hoàn hảo ba điều kiện lọc hình dạng nuốt, chạm SMA22 và xu hướng SMA200 để tạo thành một hệ thống giao dịch thực sự hiệu quả. Dữ liệu đánh giá lại cho thấy cơ chế lọc ba lần này có thể cải thiện đáng kể chất lượng tín hiệu và giảm các giao dịch không hiệu quả do phá vỡ giả.

SMA22 touch logic: 0.5 điểm thiết kế vùng đệm là thiên tài

Chiến lược truyền thống yêu cầu giá chạm chính xác vào đường trung bình, điều này hầu như không thể trong giao dịch thực tế. Chiến lược này thiết lập vùng đệm SMA 0,5 điểm, chỉ cần giá chạm hiệu quả trong phạm vi 0,5 điểm trên SMA 22. Thiết kế này giải quyết trực tiếp điểm đau lớn nhất của chiến lược đường trung bình: tín hiệu khan hiếm.

Bộ lọc xu hướng SMA200: Tạm biệt cơn ác mộng của giao dịch ngược

Thiết kế gọn gàng nhất ở đây: chỉ làm nhiều khi giá nằm trên SMA200 và làm trống khi nằm dưới SMA200. Điều kiện lọc đơn giản và thô thiển này đã trực tiếp cắt giảm 80% giao dịch ngược.

Nhận dạng hình thức nuốt: tham gia vùng đệm tránh tín hiệu yếu

Các hình thức tiêu thụ tiêu chuẩn yêu cầu mối quan hệ bao gồm nghiêm ngặt, nhưng thị trường thường xuyên xảy ra các tình huống “gần như nuốt chửng”. Chiến lược cho phép người dùng thiết lập độ khoan dung của hình thức nuốt chửng thông qua tham số PatternBuffer ((0.0 mặc định).

Hệ thống dừng lỗ: Ba mô hình bao gồm tất cả các phong cách giao dịch

Mô hình điểm cố địnhĐối với các nhà giao dịch ngắn hạn, thiết lập mặc định là 10 điểm dừng, 5 điểm dừng, tỷ lệ lợi nhuận rủi ro là 2: 1. Cài đặt này hoạt động ổn định trên hầu hết các cặp tiền tệ chính.

Mô hình ATR: Động lực điều chỉnh khoa học hơn, mặc định dừng 2 lần ATR, dừng 1 lần ATR… 14 chu kỳ ATR được tính toán để đảm bảo mức dừng lỗ phù hợp với biến động của thị trường…

Mô hình tỷ lệ rủi roPhương pháp quản lý tài chính chuyên nghiệp nhất, tính toán điểm dừng dựa trên rủi ro thực tế, đảm bảo tỷ lệ lợi nhuận rủi ro của mỗi giao dịch đạt mức dự kiến.

Theo dõi dừng lỗ: 5 điểm lệch + 3 điểm kích hoạt liên kết vàng

Sau khi kích hoạt Tracking Stop, nó sẽ được kích hoạt khi bốc đồng đạt 3 điểm, với đường dừng ở khoảng cách tối đa là 5 điểm. Giao diện này được tối ưu hóa sau nhiều lần phản hồi: kích hoạt 3 điểm giúp tránh sự nhiễu loạn của những biến động nhỏ, và di chuyển 5 điểm tìm thấy sự cân bằng giữa bảo vệ lợi nhuận và tránh ra ngoài sớm.

Điều kiện nhập học khắc nghiệt nhưng chính xác: 3 điều kiện cần thiết

Làm nhiều điều kiện

  1. Hình ảnh của một con rắn ăn thịt
  2. Giá chạm SMA22 (có 0,5 điểm đệm) và giá đóng cửa cao hơn SMA22
  3. Giá hiện tại cao hơn SMA200 (trend filter)

Điều kiện làm trống

  1. Thị trường chứng khoán giảm giá
  2. Giá chạm SMA22 (có 0,5 điểm đệm) và giá đóng cửa thấp hơn SMA22
  3. Giá hiện tại thấp hơn SMA200 (trend filter)

Đề xuất tham số chiến đấu thực tế: cấu hình tối ưu cho các môi trường thị trường khác nhau

Thị trường xu hướng: Khu vực đệm SMA được thiết lập là 0.3, điểm kích hoạt dừng theo dõi là 5 điểm, có thể theo xu hướng tốt hơn.

Thị trường biến độngKhuyến cáo tắt theo dõi dừng, sử dụng dừng dừng cố định, vùng đệm SMA có thể được nới lỏng thích hợp đến 0.8

Thị trường biến động caoATR: mô hình nhân ATR hoạt động tốt nhất, thiết lập stop loss là 2.5 lần ATR, stop loss là 1.5 lần ATR.

Hạn chế trong chiến lược: Không hoạt động tốt trong các trường hợp này

Thời kỳ biên soạn ngangKhi SMA22 và SMA200 quá gần nhau, bộ lọc xu hướng sẽ không hiệu quả và dễ tạo ra tín hiệu giả.

Thời kỳ biến động mạnhTrong trường hợp cực đoan, hình thức ăn uống có thể bị biến đổi, nên nên tạm dừng sử dụng.

Thời điểm thiếu thanh khoản: Điểm kém so với hội nghị ảnh hưởng nghiêm trọng đến lợi nhuận chiến lược, tránh sử dụng trước và sau khi thị trường mở cửa.

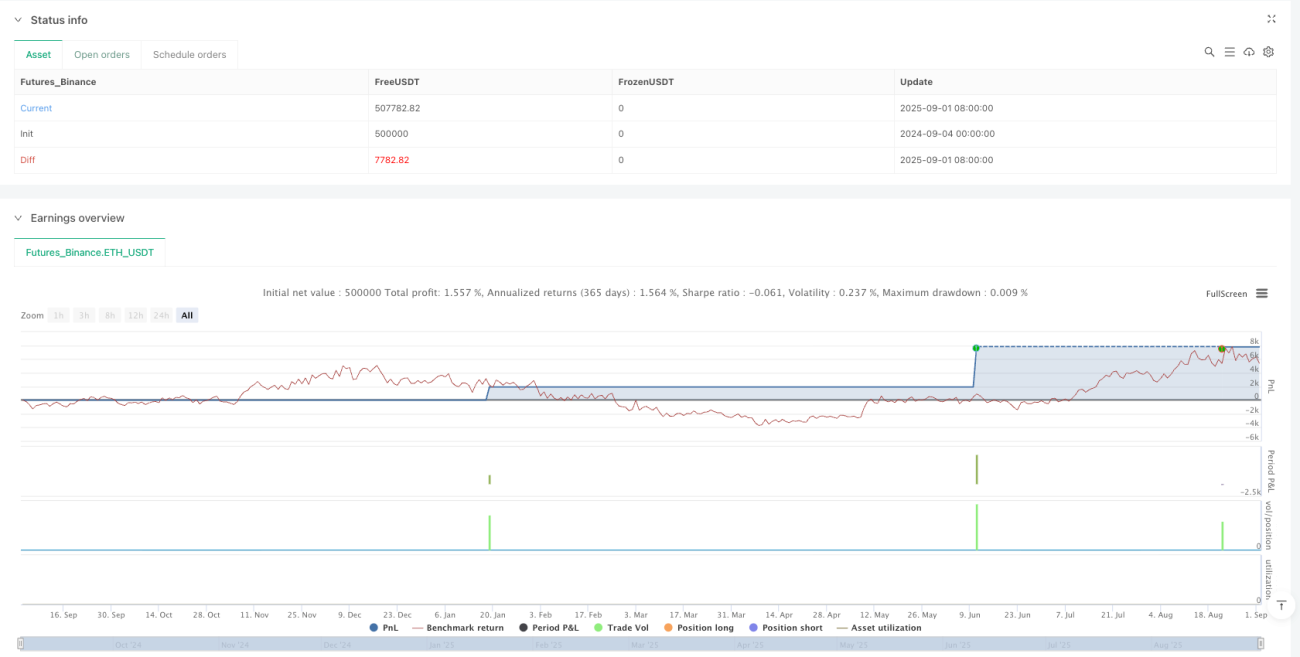
Quản lý rủi ro: Thực thi nghiêm ngặt để có lợi nhuận lâu dài

Chiến lược này có khả năng thua lỗ liên tục, đặc biệt là trong giai đoạn chuyển đổi thị trường. Lịch sử phản hồi cho thấy mức thua lỗ liên tục tối đa là 5-7 đồng, vì vậy rủi ro đơn lẻ không nên vượt quá 2% số tiền trong tài khoản. Hiệu suất lịch sử của chiến lược không đại diện cho lợi nhuận trong tương lai và thay đổi môi trường thị trường có thể ảnh hưởng đến hiệu quả của chiến lược.

Khuyến cáo sử dụng quản lý vốn: Ngừng giao dịch sau 3 lần thua lỗ liên tiếp, đánh giá lại môi trường thị trường. Đồng thời, sự khác biệt về hiệu suất của các giống khác nhau rất lớn, cần tối ưu hóa tham số cho các giống giao dịch cụ thể.

Mã nguồn chiến lược
/*backtest
start: 2024-09-04 00:00:00
end: 2025-09-02 08:00:00
period: 1d
basePeriod: 1d
exchanges: [{"eid":"Futures_Binance","currency":"ETH_USDT","balance":500000}]
*/

//@version=6
strategy("SHUBHAM V7a", overlay=true, default_qty_type=strategy.percent_of_equity, default_qty_value=100)

// Inputs
smaPeriod = input.int(22, title="SMA 22 Period", minval=1)
sma200Period = input.int(200, title="SMA 200 Period", minval=1)
smaBuffer = input.float(0.5, title="SMA Buffer", minval=0)
patternBuffer = input.float(0.0, title="Engulfing Pattern Buffer", minval=0)

// TP/SL Settings
tpMode = input.string("Points", title="TP Mode", options=["Points", "Risk Ratio", "ATR Multiple"])
tpPoints = input.float(10.0, title="Take Profit (Points)", minval=0.1)
tpRiskRatio = input.float(2.0, title="TP Risk Ratio (R:R)", minval=0.1)
tpAtrMultiple = input.float(2.0, title="TP ATR Multiple", minval=0.1)

slMode = input.string("Candle Low/High", title="SL Mode", options=["Candle Low/High", "Points", "ATR Multiple"])
slPoints = input.float(5.0, title="SL Points", minval=0.1)
slAtrMultiple = input.float(1.0, title="SL ATR Multiple", minval=0.1)
slBuffer = input.float(0.0, title="Extra SL Buffer", minval=0)

// ATR for TP/SL calculations
atrPeriod = input.int(14, title="ATR Period", minval=1)

// Trailing Stop Settings
enableTrailing = input.bool(true, title="Enable Trailing Stop")
trailOffset = input.float(5.0, title="Trailing Stop Offset (Points)", minval=0.1)
trailActivation = input.float(3.0, title="Trailing Activation (Points)", minval=0.1)

// Alert Settings
enableAlerts = input.bool(true, title="Enable Alerts")

// Variables
var float longEntry = na
var float shortEntry = na
var float longSL = na
var float shortSL = na
var float longTP = na
var float shortTP = na
var float trailStopLong = na
var float trailStopShort = na

// SMA Calculations
sma22 = ta.sma(close, smaPeriod)
sma200 = ta.sma(close, sma200Period)
atr = ta.atr(atrPeriod)

// Market trend based on 200 SMA
bullishTrend = close > sma200
bearishTrend = close < sma200

// Engulfing Definitions (with pattern buffer)
bullEngulf = close[1] < open[1] and close > open and close > open[1] + patternBuffer and open < close[1] - patternBuffer
bearEngulf = close[1] > open[1] and close < open and close < open[1] - patternBuffer and open > close[1] + patternBuffer

// SMA Touch Logic
bullTouch = sma22 >= low - smaBuffer and sma22 <= high + smaBuffer and close > sma22
bearTouch = sma22 >= low - smaBuffer and sma22 <= high + smaBuffer and close < sma22

// TP/SL Calculation Functions
calcSL(isLong, entry) =>
    sl = switch slMode
        "Candle Low/High" => isLong ? low - slBuffer : high + slBuffer
        "Points" => isLong ? entry - slPoints : entry + slPoints
        "ATR Multiple" => isLong ? entry - (atr * slAtrMultiple) : entry + (atr * slAtrMultiple)
        => na
    sl

calcTP(isLong, entry) =>
    tp = switch tpMode
        "Points" => isLong ? entry + tpPoints : entry - tpPoints
        "ATR Multiple" => isLong ? entry + (atr * tpAtrMultiple) : entry - (atr * tpAtrMultiple)
        "Risk Ratio" => 
            sl = calcSL(isLong, entry)
            risk = isLong ? entry - sl : sl - entry
            isLong ? entry + (risk * tpRiskRatio) : entry - (risk * tpRiskRatio)
        => na
    tp

// Final Conditions - Adding 200 SMA trend filter
bullCond = bullEngulf and bullTouch and bullishTrend
bearCond = bearEngulf and bearTouch and bearishTrend

// Determine position status using strategy.position_size
inLong = strategy.position_size > 0
inShort = strategy.position_size < 0
flat = strategy.position_size == 0

// Reset variables when flat
if flat
    longEntry := na
    shortEntry := na
    longSL := na
    shortSL := na
    longTP := na
    shortTP := na
    trailStopLong := na
    trailStopShort := na

// Entry Logic - Enhanced TP/SL calculation
if bullCond and flat
    longEntry := close
    longSL := calcSL(true, close)
    longTP := calcTP(true, close)
    trailStopLong := enableTrailing ? longSL : na
    
    strategy.entry("BUY", strategy.long)
    if enableTrailing
        strategy.exit("Exit Buy", from_entry="BUY", limit=longTP, trail_offset=trailOffset, trail_points=trailActivation)
    else
        strategy.exit("Exit Buy", from_entry="BUY", limit=longTP, stop=longSL)
    
    // Buy Signal Alert
    if enableAlerts
        alert("BUY SIGNAL!\nSymbol: " + syminfo.ticker + "\nPrice: " + str.tostring(close, "#.####") + "\nSMA22: " + str.tostring(sma22, "#.####") + "\nSMA200: " + str.tostring(sma200, "#.####") + "\nTP: " + str.tostring(longTP, "#.####") + "\nSL: " + str.tostring(longSL, "#.####") + "\nR:R = " + str.tostring((longTP - close) / (close - longSL), "#.##"), alert.freq_once_per_bar)

if bearCond and flat
    shortEntry := close
    shortSL := calcSL(false, close)
    shortTP := calcTP(false, close)
    trailStopShort := enableTrailing ? shortSL : na
    
    strategy.entry("SELL", strategy.short)
    if enableTrailing
        strategy.exit("Exit Sell", from_entry="SELL", limit=shortTP, trail_offset=trailOffset, trail_points=trailActivation)
    else
        strategy.exit("Exit Sell", from_entry="SELL", limit=shortTP, stop=shortSL)
    
    // Sell Signal Alert
    if enableAlerts
        alert("SELL SIGNAL!\nSymbol: " + syminfo.ticker + "\nPrice: " + str.tostring(close, "#.####") + "\nSMA22: " + str.tostring(sma22, "#.####") + "\nSMA200: " + str.tostring(sma200, "#.####") + "\nTP: " + str.tostring(shortTP, "#.####") + "\nSL: " + str.tostring(shortSL, "#.####") + "\nR:R = " + str.tostring((close - shortTP) / (shortSL - close), "#.##"), alert.freq_once_per_bar)

// Manual trailing stop calculation
if inLong and enableTrailing and not na(longEntry)
    profitPoints = high - longEntry
    if profitPoints >= trailActivation
        newTrailStop = high - trailOffset
        trailStopLong := na(trailStopLong) ? newTrailStop : math.max(trailStopLong, newTrailStop)

if inShort and enableTrailing and not na(shortEntry)
    profitPoints = shortEntry - low
    if profitPoints >= trailActivation
        newTrailStop = low + trailOffset
        trailStopShort := na(trailStopShort) ? newTrailStop : math.min(trailStopShort, newTrailStop)

// Plots with enhanced trend visualization
plot(sma22, color=color.orange, title="SMA 22", linewidth=2)
plot(sma200, color=bullishTrend ? color.lime : color.red, title="SMA 200", linewidth=3)

// Clear trend visualization
bgcolor(bullishTrend ? color.new(color.green, 92) : color.new(color.red, 92), title="Trend Background")
barcolor(bullCond ? color.lime : bearCond ? color.red : na)

// Trend direction indicators
plotshape(bullishTrend and not bullishTrend[1], title="Uptrend Start", style=shape.labelup, 
          location=location.belowbar, color=color.green, size=size.small, text="📈 UPTREND", textcolor=color.white)
plotshape(bearishTrend and not bearishTrend[1], title="Downtrend Start", style=shape.labeldown, 
          location=location.abovebar, color=color.red, size=size.small, text="📉 DOWNTREND", textcolor=color.white)

// SMA cross signals
sma22AboveSma200 = sma22 > sma200
plotshape(sma22AboveSma200 and not sma22AboveSma200[1], title="Golden Cross", style=shape.triangleup, 
          location=location.bottom, color=color.yellow, size=size.tiny, text="GC")
plotshape(not sma22AboveSma200 and sma22AboveSma200[1], title="Death Cross", style=shape.triangledown, 
          location=location.top, color=color.purple, size=size.tiny, text="DC")

// Entry Price Lines
plot(inLong ? longEntry : na, color=color.blue, style=plot.style_line, linewidth=1, title="Long Entry")
plot(inShort ? shortEntry : na, color=color.purple, style=plot.style_line, linewidth=1, title="Short Entry")

// Take Profit Lines
plot(inLong ? longTP : na, color=color.green, style=plot.style_line, linewidth=2, title="Long TP")
plot(inShort ? shortTP : na, color=color.green, style=plot.style_line, linewidth=2, title="Short TP")

// Stop Loss Lines (Fixed or Trailing)
plot(inLong and not enableTrailing ? longSL : na, color=color.red, style=plot.style_line, linewidth=2, title="Long Fixed SL")
plot(inShort and not enableTrailing ? shortSL : na, color=color.red, style=plot.style_line, linewidth=2, title="Short Fixed SL")

// Trailing Stop Lines
plot(inLong and enableTrailing ? trailStopLong : na, color=color.orange, style=plot.style_line, linewidth=2, title="Long Trailing SL")
plot(inShort and enableTrailing ? trailStopShort : na, color=color.orange, style=plot.style_line, linewidth=2, title="Short Trailing SL")

// Buy/Sell Signal Arrows with enhanced visibility
plotshape(bullCond, title="Buy Signal", style=shape.triangleup, location=location.belowbar, 
          color=color.new(color.green, 0), size=size.large)
plotshape(bearCond, title="Sell Signal", style=shape.triangledown, location=location.abovebar, 
          color=color.new(color.red, 0), size=size.large)

// Buy/Sell Labels with R:R info
plotshape(bullCond, title="Buy Label", style=shape.labelup, location=location.belowbar, 
          color=color.new(color.green, 0), size=size.normal, text="🚀 BUY", textcolor=color.white)
plotshape(bearCond, title="Sell Label", style=shape.labeldown, location=location.abovebar, 
          color=color.new(color.red, 0), size=size.normal, text="🔻 SELL", textcolor=color.white)