
🚀 Chiến lược này mạnh mẽ đến mức nào?
Bạn có biết không? Chiến lược này giống như việc trang bị cho giao dịch của bạn một "đôi mắt tinh anh"! Nó được thiết kế dành riêng cho giao dịch siêu ngắn hạn trên khung 1 phút và 5 phút, kết hợp 5 chỉ báo kỹ thuật mạnh mẽ nhất: EMA nhanh và chậm, RSI, MACD, Bollinger Bands, cùng bộ lọc khối lượng. Nói một cách đơn giản, nó giúp bạn nắm bắt chính xác từng biến động nhỏ trên thị trường!
💡 Điểm mấu chốt! Cú đấm tổ hợp này đánh như thế nào?
Hãy tưởng tượng, chiến lược này giống như một "nhà tuyển dụng" cực kỳ nghiêm ngặt, chỉ những cơ hội giao dịch đáp ứng đồng thời nhiều điều kiện mới vượt qua vòng sàng lọc:
Tín hiệu tăng phải thỏa mãn: Giá nằm trên EMA nhanh, MACD cắt lên và dương, phá vỡ dải trên Bollinger Bands, RSI nằm trong khoảng 50-80, và có khối lượng giao dịch đủ lớn hỗ trợ. Giống như yêu cầu một người vừa có ngoại hình đẹp, vừa có tài năng, lại vừa có tính cách tốt vậy!
Tín hiệu giảm thì ngược lại: Tất cả các điều kiện đều phải thỏa mãn theo chiều ngược lại, đảm bảo mỗi giao dịch đều có nền tảng kỹ thuật vững chắc.
⚡ Hướng dẫn tránh bẫy: Tại sao chọn siêu ngắn hạn?
Điểm thông minh nhất của chiến lược này nằm ở việc kiểm soát rủi ro! Cắt lỗ ở mức 0,5%, chốt lời ở mức 1,0%, tỷ lệ rủi ro/lợi nhuận đạt 1:2. Giống như một cách diễn giải hoàn hảo của "cược nhỏ vui vẻ" – mỗi lần thua lỗ rất nhỏ, nhưng lợi nhuận có thể tăng gấp đôi!
Ngoài ra, nó còn có một thiết kế tinh tế: Trên biểu đồ 1 phút, chức năng nhận dạng mô hình nến sẽ tự động tắt, vì tiếng ồn của các mô hình nến trong siêu ngắn hạn quá lớn, dễ gây hiểu lầm. Điều này giống như việc tự động giảm tiếng ồn trong môi trường ồn ào vậy!
🎯 Ứng dụng thực tế: Chiến lược này giúp bạn giải quyết vấn đề gì?
Đối tượng phù hợp: Những ai muốn thực hiện giao dịch trong ngày trên thị trường tiền điện tử, đặc biệt là những nhà giao dịch muốn tích lũy lợi nhuận thông qua các giao dịch nhỏ nhưng thường xuyên.
Giải quyết vấn đề: Nói lời tạm biệt với những tín hiệu giả từ các chỉ báo đơn lẻ! Thông qua cơ chế xác nhận nhiều lớp, độ tin cậy của tín hiệu được cải thiện đáng kể. Đồng thời, kiểm soát rủi ro nghiêm ngặt giúp bạn ngay cả khi đánh giá sai, tổn thất vẫn nằm trong tầm kiểm soát.
Hãy nhớ rằng, chiến lược này giống như một con dao mổ chính xác, cần được sử dụng trên các cặp tiền điện tử có tính thanh khoản cao để đạt hiệu quả tốt nhất. Kết hợp với quản lý vốn tốt, nó có thể trở thành trợ thủ đắc lực trong kho vũ khí giao dịch của bạn!
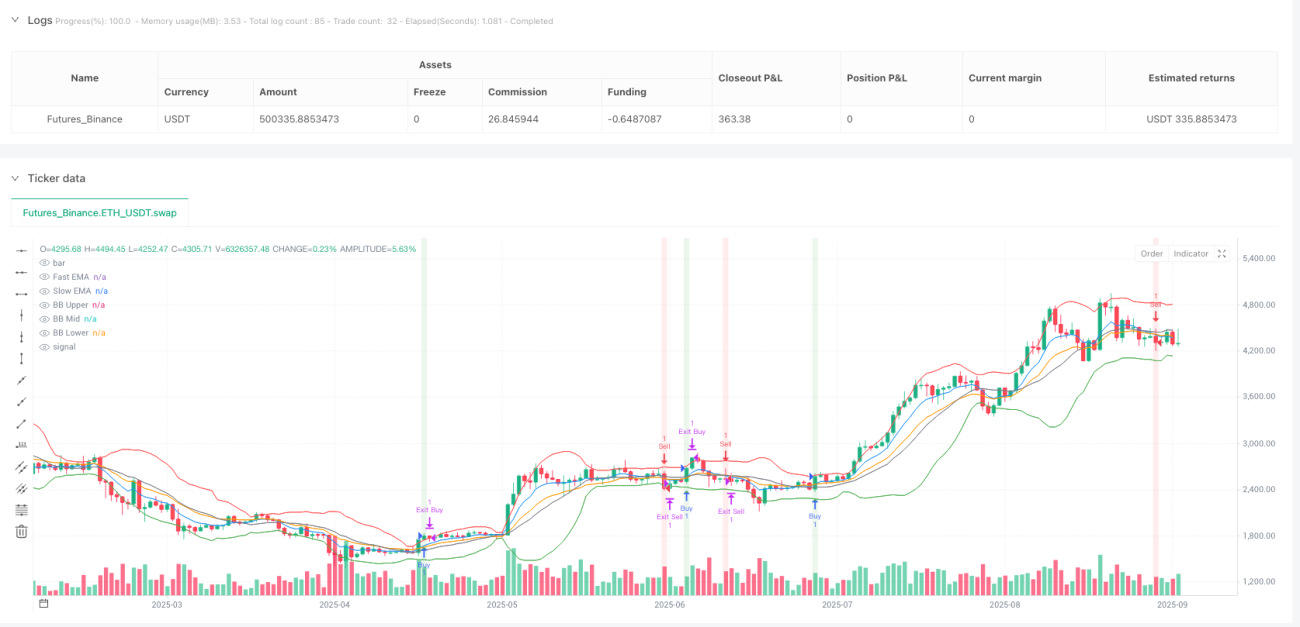
/*backtest
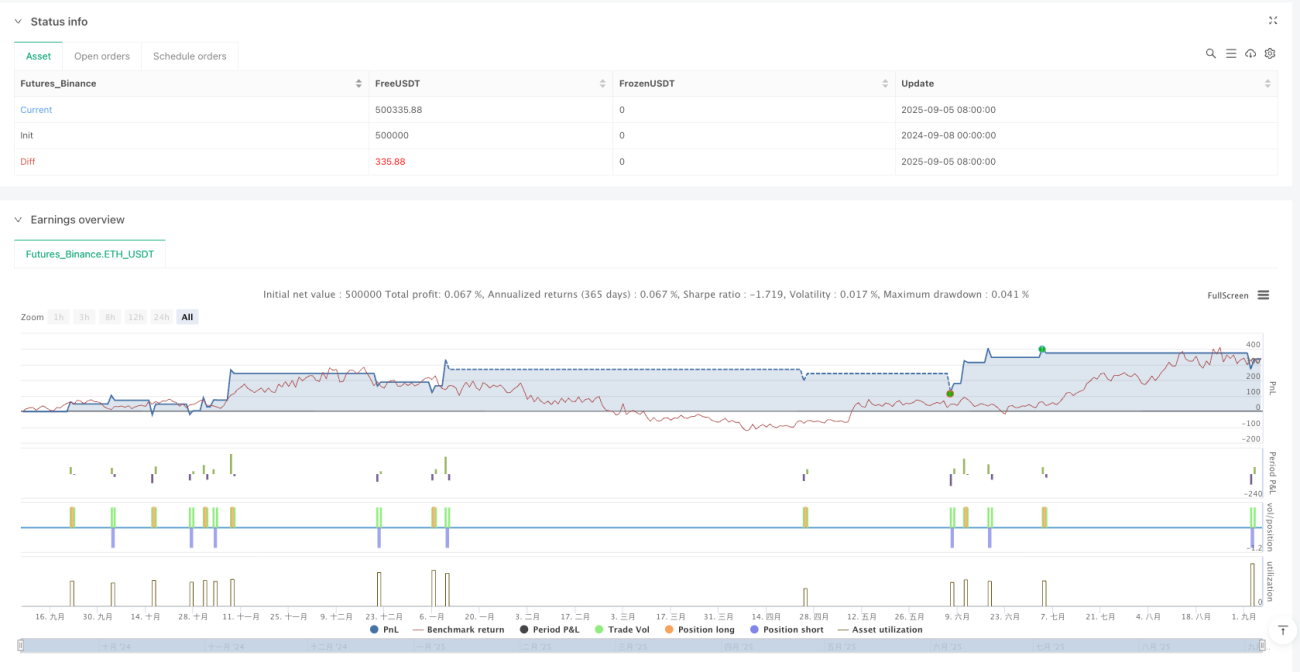
start: 2024-09-08 00:00:00
end: 2025-09-06 08:00:00
period: 1d
basePeriod: 1d
exchanges: [{"eid":"Futures_Binance","currency":"ETH_USDT","balance":500000}]
*/
//@version=5
strategy("Advanced Crypto Scalping Strategy - 1 & 5 Min Charts", overlay=true, margin_long=100, margin_short=100)
// Inputs for customization (optimized for 1-min and 5-min timeframes)- 1