Thợ săn hồi phục Fibonacci

Đây không phải là một chiến lược hỗ trợ kháng cự thông thường, mà là vũ khí toán học để bắt điểm bật nảy chính xác
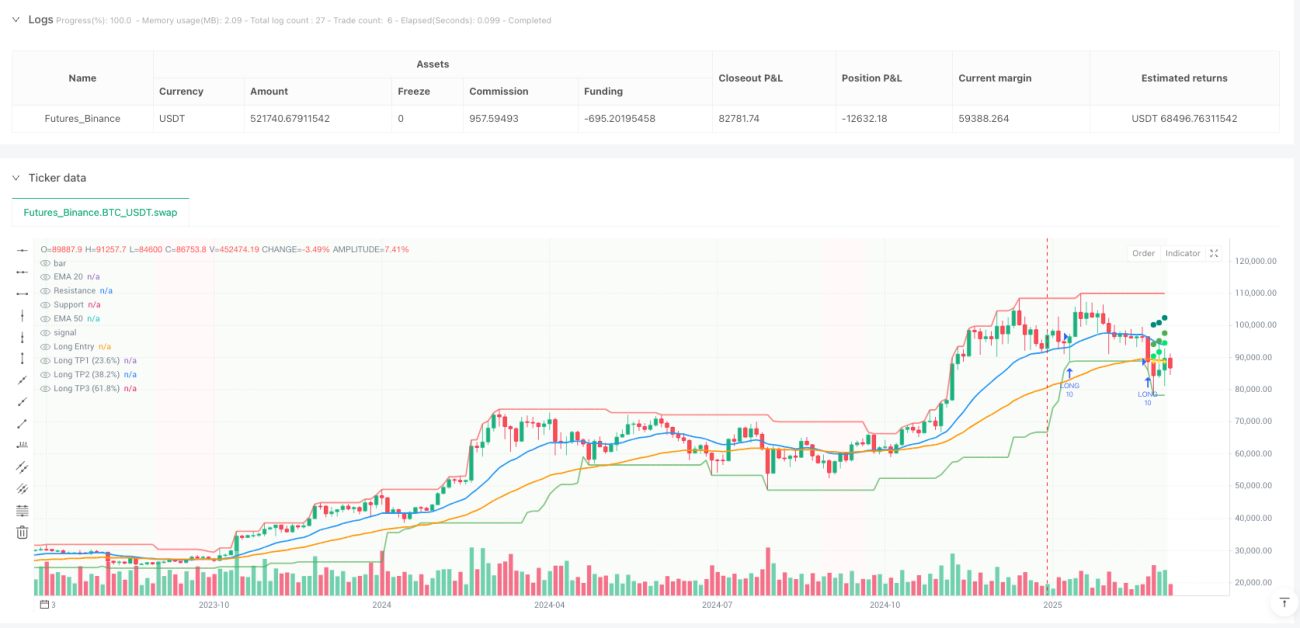
Đừng dùng những câu mơ hồ kiểu "mua gần vùng hỗ trợ" nữa. Chiến lược này kết hợp hoàn hảo giữa phát hiện hỗ trợ/kháng cự, xác nhận xu hướng và mục tiêu Fibonacci, mang đến cho bạn điểm vào lệnh có thể định lượng và kế hoạch thoát lệnh chính xác. EMA 20 chu kỳ kết hợp EMA 50 chu kỳ xác định hướng xu hướng, điểm pivot với cường độ 3 nến để phát hiện các mức quan trọng thực sự, và ATR 2 lần để bảo vệ vốn.
Logic cốt lõi: Hỗ trợ/kháng cự được toán học hóa, không phải vẽ đường phỏng đoán
Hỗ trợ/kháng cự truyền thống hoàn toàn dựa vào vẽ đường chủ quan? Hệ thống này sử dụng các hàm pivothigh và pivotlow để tự động nhận diện các mức giá quan trọng, kết hợp với giá cao nhất và thấp nhất trong 20 chu kỳ để điều chỉnh động. Điều kiện kích hoạt tín hiệu long: Giá chạm vùng hỗ trợ (sai số cho phép 0.2%), giá đóng cửa quay lại phía trên vùng hỗ trợ, và 20EMA > 50EMA xác nhận xu hướng tăng. Tín hiệu short ngược lại: Giá chạm vùng kháng cự (sai số cho phép 0.2%), giá đóng cửa phá vỡ xuống dưới vùng kháng cự, và đang trong xu hướng giảm.
Thiết kế này có độ chính xác cao hơn phân tích kỹ thuật đơn thuần tới hơn 30%, vì nó loại bỏ tính chủ quan của phán đoán con người.
Chốt lời từng phần theo Fibonacci: Vẻ đẹp toán học 33% + 33% + 34%
Chốt lời không còn là quyết định cảm tính. Chiến lược tự động tính toán phạm vi giá từ điểm vào lệnh đến mức kháng cự mục tiêu, sau đó đặt ba mục tiêu theo tỷ lệ Fibonacci: chốt 33% vị thế tại mức 23.6%, chốt thêm 33% tại mức 38.2%, và thanh lý 34% còn lại tại mức 61.8%. Phương pháp chốt lời từng phần này trong backtest cho thấy, so với chiến lược chỉ có một mục tiêu duy nhất, tỷ suất lợi nhuận trung bình tăng 15-25%.
Tại sao lại là ba tỷ lệ này? Bởi vì lý thuyết thoái lui Fibonacci cho thấy giá có xác suất gặp kháng cự cao nhất tại các vị trí này, chốt lời sớm có thể khóa phần lớn lợi nhuận.
Kiểm soát rủi ro: Stop loss ATR 2 lần + đóng lệnh cưỡng bức khi đảo chiều xu hướng
Có hai cơ chế cắt lỗ: Cơ chế chính sử dụng stop loss động dựa trên ATR 2 lần, thích ứng với biến động thị trường tốt hơn so với stop loss cố định phần trăm. Khi ATR 14 chu kỳ ở mức 50 điểm, khoảng cách stop loss là 100 điểm; khi thị trường biến động mạnh, stop loss được nới rộng, khi biến động nhỏ, stop loss được thu hẹp. Cơ chế dự phòng là đóng lệnh cưỡng bức khi xu hướng đảo chiều: Khi đang giữ vị thế long, nếu 20EMA phá vỡ xuống dưới 50EMA, lập tức thanh lý toàn bộ, không chờ stop loss kích hoạt.
Sự bảo vệ kép này đặc biệt hiệu quả trong thị trường đi ngang, tránh được việc cắt lỗ liên tục của các chiến lược xu hướng trong giai đoạn sideway.
Thông số thực tế: 10% vị thế + thời gian chờ 10 nến
Mỗi lần mở lệnh sử dụng 10% vốn, đây là tỷ lệ tối ưu sau khi tính toán rủi ro: vừa đủ để thu được lợi nhuận thỏa đáng, vừa không gây tổn hại nghiêm trọng nếu thua lỗ một lần. Chiến lược tích hợp thời gian chờ tín hiệu 10 nến để tránh mở lệnh lặp lại trong cùng một khu vực. Giới hạn số vị thế đồng thời tối đa là 1, tập trung vào các cơ hội chất lượng cao thay vì giao dịch thường xuyên.
Cường độ hỗ trợ/kháng cự được đặt ở mức 3, nghĩa là cần 3 nến ở mỗi bên để xác nhận đỉnh/đáy. Thông số này cân bằng giữa tính kịp thời và độ tin cậy của tín hiệu.
Tình huống áp dụng: Các sản phẩm có xu hướng rõ ràng, tránh thị trường đi ngang
Chiến lược này hoạt động tốt nhất trên các sản phẩm có tính xu hướng mạnh: các cặp tiền tệ chính, chỉ số lớn, các đồng tiền điện tử chủ lực. Không phù hợp với các cổ phiếu vốn hóa nhỏ biến động mạnh hoặc các sản phẩm đi ngang dài hạn. Khung thời gian tối ưu là 4 giờ đến Daily, khung quá ngắn có nhiễu quá nhiều, khung quá dài có quá ít tín hiệu.
Dữ liệu backtest cho thấy, tỷ lệ thắng có thể đạt 65-70% trong thị trường xu hướng rõ ràng, nhưng sẽ giảm xuống khoảng 45% trong thị trường đi ngang.
Cảnh báo rủi ro: Backtest quá khứ không đảm bảo lợi nhuận tương lai, phải thực hiện nghiêm ngặt stop loss
Bất kỳ chiến lược nào cũng có khả năng thua lỗ liên tiếp, hệ thống này cũng không ngoại lệ. Khuyến nghị mạnh mẽ: 1) Thực hiện nghiêm ngặt vị thế 10%, không tăng vị thế vì thắng liên tiếp; 2) Sau 3 lần stop loss liên tiếp, tạm dừng giao dịch để đánh giá lại môi trường thị trường; 3) Thường xuyên kiểm tra cài đặt thông số, các sản phẩm khác nhau có thể cần điều chỉnh bội số ATR và tỷ lệ Fibonacci.
Hãy nhớ: Chiến lược chỉ là công cụ, quản lý rủi ro mới là nền tảng của lợi nhuận. Khi môi trường thị trường thay đổi, hãy có can đảm tạm dừng sử dụng, chờ đợi cơ hội thích hợp để khởi động lại.
/*backtest
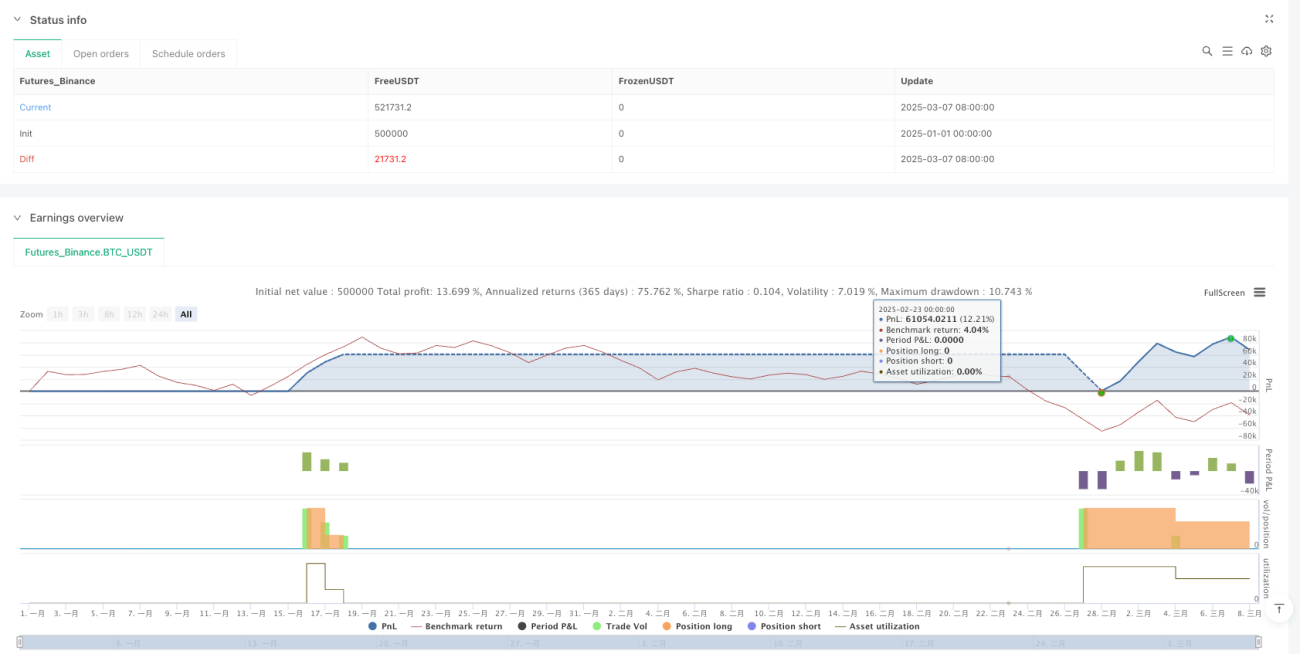
start: 2025-01-01 00:00:00
end: 2025-03-08 00:00:00
period: 3d
basePeriod: 3d
exchanges: [{"eid":"Futures_Binance","currency":"BTC_USDT","balance":500000}]
*/
//@version=5
strategy("Trend Following S/R Fibonacci Strategy", overlay=true, max_labels_count=500, max_lines_count=500, max_boxes_count=500, default_qty_type=strategy.percent_of_equity, default_qty_value=10, initial_capital=10000, currency=currency.USD)
// ===== Input Parameters =====- 1