Chiến lược chấm điểm nhận dạng dao động

Đây không phải là chiến lược swing thông thường, mà là hệ thống bắn tỉa chính xác có điểm AI
Vấn đề của chiến lược swing truyền thống là gì? Quá nhiều tín hiệu, chất lượng không đồng đều, phá vỡ giả diễn ra thường xuyên. Chiến lược này giải quyết trực tiếp điểm đau: Mỗi tín hiệu đều có điểm chất lượng từ 1-5, chỉ giao dịch các tín hiệu chất lượng từ 4 điểm trở lên.
Logic cốt lõi đơn giản và mạnh mẽ: Xác định Higher Low (đáy cao hơn) và Lower High (đỉnh thấp hơn), sau đó chấm điểm tín hiệu dựa trên 4 khía cạnh. Chỉ mở lệnh khi đạt tối thiểu 4 điểm, trực tiếp lọc bỏ 80% tín hiệu rác.
Hệ thống chấm điểm 5 khía cạnh mạnh hơn so với chỉ báo đơn lẻ ở chỗ nào?
Điểm cơ bản 1 điểm: Xác nhận sự tồn tại của mô hình swing
Xác nhận khối lượng +1 điểm: Khối lượng vượt quá 1.2 lần giá trị trung bình 20 chu kỳ, cho thấy có dòng tiền đồng thuận
Vị trí RSI +1 điểm: RSI nằm trong khoảng 30-70, tránh các tín hiệu giả khi quá mua/quá bán
Thân nến +1 điểm: Tỷ lệ thân nến trên 60%, đảm bảo không phải các dạng do dự như doji
Căn chỉnh xu hướng +1 điểm: Giá, MA20 và MA50 cùng hướng
Kết quả: Tín hiệu đạt 5 điểm có tỷ lệ thắng cao nhất, tín hiệu từ 4 điểm trở lên có thể giao dịch, tín hiệu dưới 3 điểm bỏ qua hoàn toàn.
Thiết kế stop loss: Cực trị 10 chu kỳ, không phải ATR tùy ý
Logic stop loss rất rõ ràng:
- Long stop loss = điểm thấp nhất của 10 nến trước đó
- Short stop loss = điểm cao nhất của 10 nến trước đó
Tại sao là 10 chu kỳ? Bởi vì bản chất chiến lược swing là bắt đảo chiều ngắn hạn, 10 chu kỳ vừa đủ không gian cho giá biến động, vừa không khiến stop loss quá xa. Phù hợp với cấu trúc thị trường hơn so với bội số ATR cố định.
Tín hiệu thất bại cũng là cơ hội giao dịch
Chiến lược còn nhận diện "swing thất bại":
- Higher Low thất bại: Hình thành đáy cao hơn nhưng sau đó lại phá vỡ
- Lower High thất bại: Hình thành đỉnh thấp hơn nhưng sau đó lại phá vỡ
Những thất bại này thường báo hiệu xu hướng tăng tốc, là thời điểm tuyệt vời để giao dịch ngược chiều.
Tín hiệu liên tiếp = xác nhận xu hướng
Khi hai nến liên tiếp xuất hiện tín hiệu xác nhận cùng hướng, sẽ được đánh dấu bằng hình kim cương. Điều này thường có nghĩa là:
- Liên tiếp xem tăng: Xu hướng tăng được xác lập
- Liên tiếp xem giảm: Xu hướng giảm được xác lập
Tỷ lệ thắng của tín hiệu liên tiếp thường cao hơn 15-20% so với tín hiệu đơn lẻ.
Bối cảnh áp dụng: Thị trường dao động thiên tăng/thiên giảm
Môi trường hoạt động tốt nhất:
- Thị trường có xu hướng rõ ràng nhưng thường xuyên điều chỉnh
- Biến động vừa phải (không quá yên tĩnh cũng không quá dữ dội)
- Khối lượng tương đối ổn định
Tránh sử dụng trong các trường hợp:
- Một chiều tăng/giảm mạnh (tín hiệu swing sẽ thường xuyên bị phá vỡ)
- Đi ngang biến động rất thấp (tín hiệu hiếm và chất lượng kém)
- Các sản phẩm ít thanh khoản với khối lượng cực kỳ bất ổn
Cảnh báo rủi ro: Backtest trong quá khứ không đảm bảo lợi nhuận tương lai
Rủi ro rõ ràng:
- Chiến lược có thể thua lỗ liên tiếp, đặc biệt trong giai đoạn chuyển đổi xu hướng
- Mặc dù tín hiệu từ 4 điểm trở lên có chất lượng cao, nhưng vẫn có tỷ lệ thất bại 30-40%
- Thiết kế stop loss tương đối rộng, một lần thua lỗ có thể lớn
- Hiệu suất khác biệt rõ rệt trong các môi trường thị trường khác nhau
Khuyến nghị quản lý vốn: Rủi ro mỗi lần không quá 2% tài khoản, sau 3 lần thua liên tiếp nên tạm dừng giao dịch để đánh giá lại môi trường thị trường.
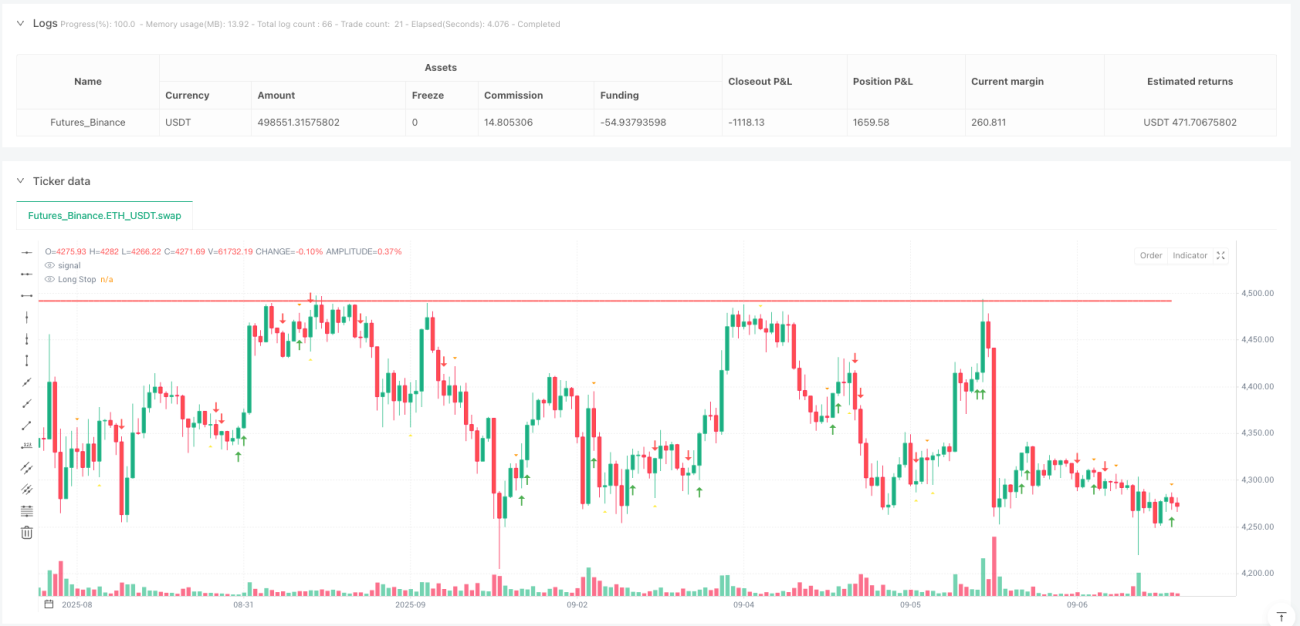
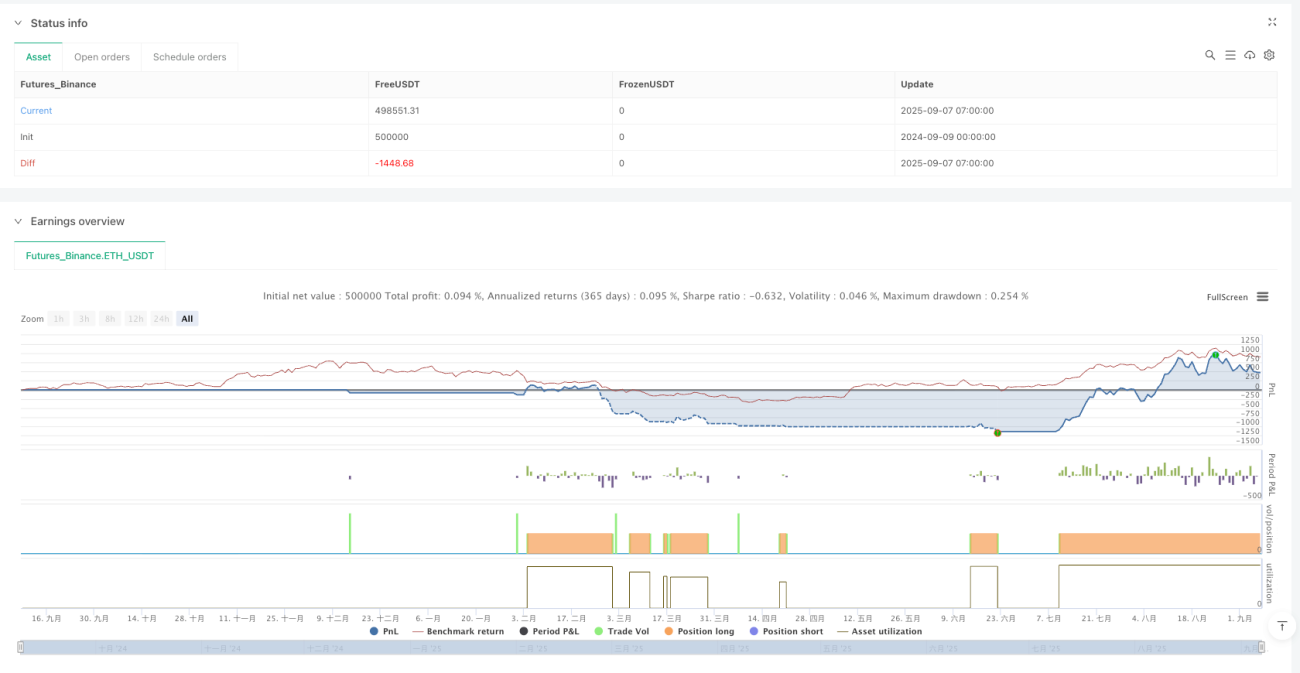
/*backtest
start: 2024-09-09 00:00:00
end: 2025-09-07 08:00:00
period: 1h
basePeriod: 1h
exchanges: [{"eid":"Futures_Binance","currency":"ETH_USDT","balance":500000}]
*/

//@version=6
strategy("Higher Lows, Lower Highs & Failures with Signal Quality Scoring", overlay=true)

// --- Higher Low detection ---- 1