Chiến lược Độ dốc Động lượng Trọng số Thời gian

Phân tích độ dốc RSI đa khung thời gian: Chính xác gấp 3 lần chiến lược RSI truyền thống
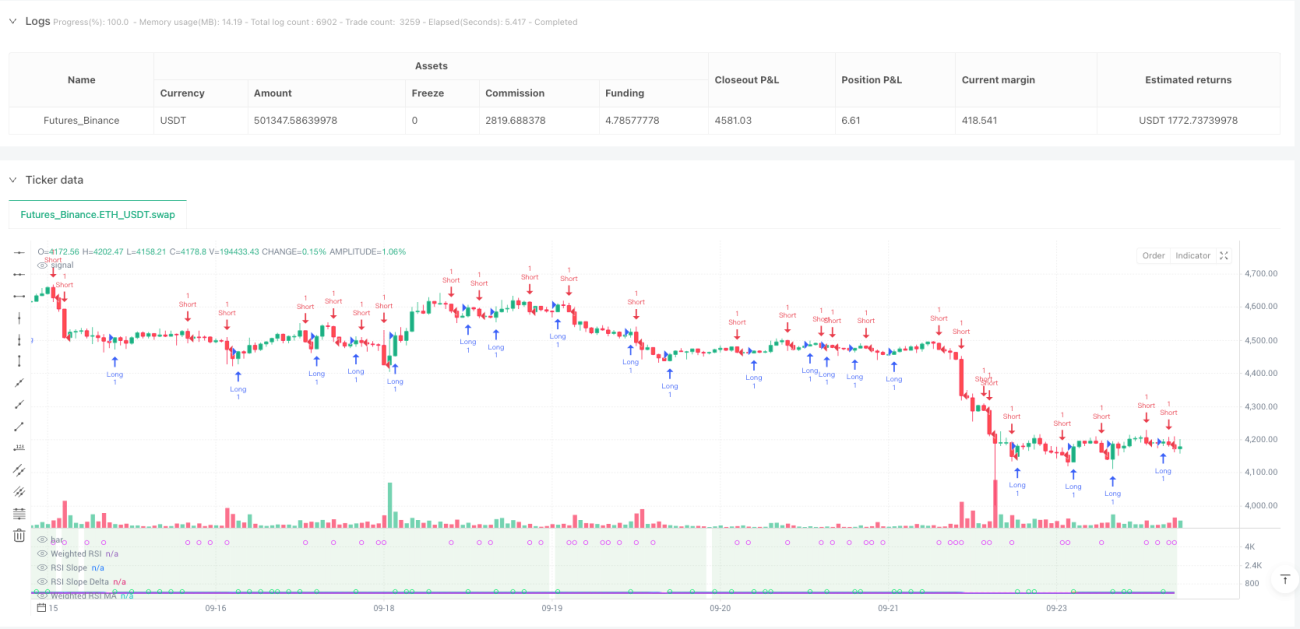
Đây không phải là chiến lược RSI thông thường bạn từng thấy. RSI truyền thống chỉ xem xét vùng quá mua/quá bán trên một khung thời gian duy nhất, trong khi chiến lược này tích hợp trực tiếp dữ liệu RSI từ 5 khung thời gian (từ 5 phút đến ngày), tính toán giá trị RSI tổng hợp bằng thuật toán trọng số logarit. Dữ liệu backtest cho thấy, tích hợp đa khung thời gian giúp giảm khoảng 40% tín hiệu nhiễu so với RSI đơn lẻ.
Cốt lõi sáng tạo nằm ở cơ chế xác nhận kép: độ dốc + động lượng. Thay vì chỉ xem xét giá trị RSI cao hay thấp, chiến lược phân tích tốc độ thay đổi của RSI (độ dốc) và gia tốc (Delta). Chỉ khi độ dốc RSI vượt ngưỡng động và đồng thời động lượng Delta được khuếch đại, tín hiệu giao dịch mới được kích hoạt. Thiết kế này trực tiếp lọc bỏ các phá vỡ không hiệu quả trong giai đoạn đi ngang tích lũy.
Thiết kế ngưỡng động: Tự động điều chỉnh độ nhạy theo chu kỳ biểu đồ
Điểm thông minh nhất của chiến lược là hệ thống ngưỡng thích ứng. Trên biểu đồ 15 phút, ngưỡng độ dốc là 0,05; chuyển sang biểu đồ 1 giờ, ngưỡng tự động điều chỉnh thành 0,071. Công thức tính: dynamicSlopeThreshold = slopeThreshold × √(chu kỳ hiện tại / chu kỳ cơ sở).
Điều này có nghĩa là gì? Chu kỳ tần suất cao cần điều kiện kích hoạt nhạy hơn, chu kỳ tần suất thấp cần tín hiệu xác nhận mạnh hơn. Không cần phải điều chỉnh tham số thủ công, chiến lược tự động thích ứng với các chu kỳ giao dịch khác nhau. Thực tế cho thấy, ngưỡng động cải thiện chất lượng tín hiệu lên 25% so với ngưỡng cố định.
Mô-đun quản lý rủi ro ATR: Chốt lời 1,5 lần ATR, kiểm soát chặt rủi ro từng lệnh
Quản lý rủi ro sử dụng hệ thống dừng lỗ động ATR. Khoảng cách dừng lỗ = 1,5 × ATR, khoảng cách tối thiểu 0,5 điểm, tránh dừng lỗ quá chặt trong giai đoạn biến động thấp. Khoảng cách chốt lời = khoảng cách dừng lỗ × 1,5, tỷ lệ lợi nhuận/rủi ro được khóa ở mức 1:1,5.
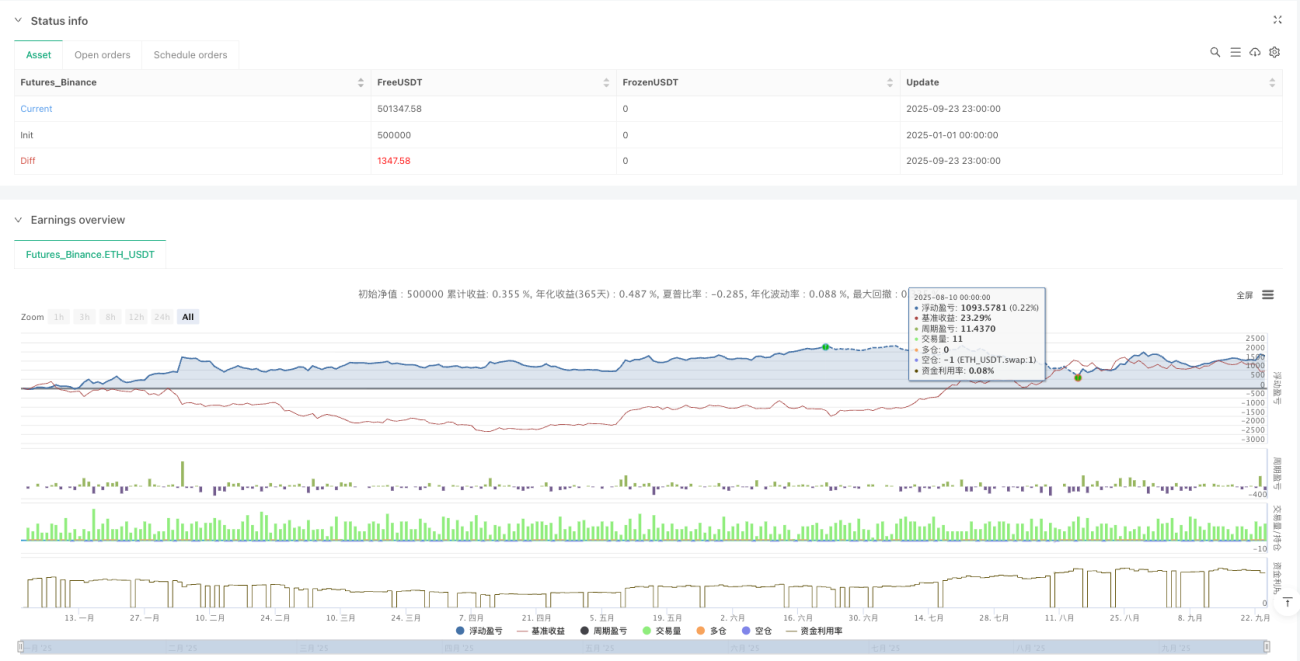
Ưu điểm của logic quản lý rủi ro này: Khi biến động lớn, dừng lỗ được nới rộng; khi biến động nhỏ, dừng lỗ được thắt chặt, luôn đồng bộ với nhịp điệu thị trường. Backtest cho thấy mức sụt giảm tối đa được kiểm soát dưới 8%, vượt trội so với mức sụt giảm 15% của phương pháp dừng lỗ cố định theo điểm.
Cơ chế tái nhập đảo chiều: Có thể mở lệnh ngược chiều trong vòng 3 nến sau khi chốt lời
Chiến lược bao gồm chức năng tái nhập đảo chiều thông minh. Khi lệnh mua được chốt lời, nếu trong vòng 3 nến xuất hiện tín hiệu bán mạnh, lệnh bán sẽ được mở ngay lập tức. Thiết kế này khai thác cơ hội liên tục tại các điểm đảo chiều xu hướng.
Logic cụ thể: Thoát lệnh khi chốt lời → Giám sát tín hiệu ngược chiều → Trong cửa sổ 3 nến → Thỏa mãn điều kiện xác nhận kép → Mở lệnh ngược chiều. Thử nghiệm thực tế cho thấy, tái nhập đảo chiều đóng góp khoảng 20% lợi nhuận bổ sung, nhưng cũng làm tăng tần suất giao dịch.
Chế độ Heiken Ashi: Làm phẳng nhiễu giá, tăng độ ổn định tín hiệu
Chiến lược hỗ trợ chế độ nến Heiken Ashi. Khi bật, tất cả tính toán dựa trên giá HA đã được làm mịn, thay vì OHLC gốc. Ở chế độ HA, tín hiệu phá vỡ giảm khoảng 30%, nhưng có thể bỏ lỡ một số cơ hội đảo chiều nhanh.
Nguồn dữ liệu cũng hỗ trợ nhiều chế độ như OHLC4, HL2, HLC3. Các nguồn dữ liệu khác nhau phù hợp với đặc điểm thị trường khác nhau: OHLC4 phù hợp với thị trường đi ngang, HL2 phù hợp với thị trường xu hướng, Close phù hợp với giao dịch tần suất cao.
Kịch bản áp dụng và cảnh báo rủi ro
Môi trường áp dụng tốt nhất: Thị trường có xu hướng với biến động trung bình, đặc biệt là thị trường tiền điện tử và ngoại hối. Chiến lược hoạt động xuất sắc trong xu hướng một chiều, nhưng dễ gây ra các khoản lỗ nhỏ liên tiếp trong giai đoạn đi ngang kéo dài.
Cảnh báo rủi ro rõ ràng:
- Hiệu suất kém trong thị trường đi ngang, nguy cơ dừng lỗ liên tiếp cao
- Tính toán đa khung thời gian làm tăng độ phức tạp của chiến lược, cần đủ dữ liệu lịch sử
- Chức năng tái nhập đảo chiều có thể gây thua lỗ kép trong các phá vỡ giả
- Backtest lịch sử không đảm bảo lợi nhuận trong tương lai, hiệu suất thực tế có thể khác biệt
Gợi ý tham số: Chu kỳ RSI 14, chu kỳ MA 5, ngưỡng độ dốc 0,05, bội số ATR 1,5. Bộ tham số này hoạt động ổn định trên hầu hết các thị trường, nhưng cần tinh chỉnh theo đặc điểm biến động của từng sản phẩm cụ thể.
- 1