Chiến lược Scalping động lượng RSI

RSI 8 kỳ + Ngưỡng động lượng 14: Đây không phải là chiến lược RSI truyền thống
Đừng dùng RSI 14 kỳ nữa. Chiến lược này nén chu kỳ RSI xuống còn 8, kết hợp với ngưỡng động lượng 14 điểm, chuyên bắt các đợt bùng nổ ngắn hạn. Chiến lược RSI truyền thống thường bị "vả mặt" liên tục trong thị trường dao động, trong khi bộ combo này hoạt động ổn định hơn trong biến động tần suất cao.
Logic cốt lõi rất trực tiếp: Khi biến động RSI > 14 kích hoạt tín hiệu long, < -14 kích hoạt tín hiệu short. Đồng thời yêu cầu khối lượng vượt quá trung bình khối lượng 13 kỳ, đảm bảo không phải phá vỡ giả. Thiết kế này đi trước tín hiệu quá mua/quá bán RSI thuần túy 1-2 kỳ, bắt kịp thời điểm vàng khi xu hướng khởi động.
Chốt lời 4.15% vs Cắt lỗ 1.85%: Tỷ lệ lợi nhuận/rủi ro hơn 2:1
Chốt lời 4.15%, cắt lỗ 1.85%, tỷ lệ lợi nhuận/rủi ro đạt 2.24:1. Tỷ lệ này khá mạnh trong chiến lược scalp, nhưng kết hợp với cắt lỗ di động 2.55%, kiểm soát rủi ro thực tế chặt chẽ hơn.
Điểm mấu chốt là thiết kế cắt lỗ di động: Khi giá di chuyển theo hướng có lợi, đường cắt lỗ sẽ điều chỉnh động theo điểm cao nhất/thấp nhất. Điều này có nghĩa là ngay cả khi không đạt mục tiêu chốt lời 4.15%, vẫn có thể khóa phần lớn lợi nhuận. Trong thực chiến, nhiều giao dịch sẽ bị đưa ra ở vị trí 2-3% bởi cắt lỗ di động, tránh bị chốt lời quay đầu.
Bộ lọc khối lượng: Hệ số nhân 1x có vẻ thận trọng, nhưng thực tế chính xác
Khối lượng phải vượt quá trung bình khối lượng 13 kỳ mới được mở vị thế. Thiết kế này lọc bỏ 90% tín hiệu giả. Nhiều chiến lược RSI thường xuyên mở vị thế trong môi trường khối lượng thấp và bị "vả mặt" qua lại.
Đường trung bình khối lượng 13 kỳ nhạy hơn so với mức 20 kỳ phổ biến, có thể nhận diện dòng tiền vào nhanh hơn. Hệ số nhân 1x trông có vẻ thấp, nhưng kết hợp với phản ứng nhanh của RSI 8 kỳ, đã đủ để sàng lọc các cơ hội phá vỡ thực sự.
Ba điều kiện vào lệnh: Không phải mọi tín hiệu RSI đều đáng giao dịch
Vào lệnh long cần thỏa mãn một trong ba điều kiện: Động lượng RSI > 14, RSI bật lên từ vùng quá bán, RSI cắt lên trên đường quá bán. Thiết kế này linh hoạt hơn so với một điều kiện đơn lẻ, thích ứng với các trạng thái thị trường khác nhau.
Đường quá bán đặt ở 10, quá mua đặt ở 90, cực đoan hơn so với mức 30/70 truyền thống. Lợi ích là giảm tín hiệu giả, bất lợi là có thể bỏ lỡ một số cơ hội. Nhưng đối với chiến lược scalp, thà bỏ lỡ còn hơn sai lầm.
Kịch bản áp dụng: Thiên đường giao dịch ngắn hạn cho các sản phẩm biến động cao
Chiến lược này phù hợp nhất với các sản phẩm biến động cao như tiền điện tử, các cặp chính ngoại hối, cổ phiếu nóng. Hiệu suất sẽ giảm mạnh trên các cổ phiếu blue-chip hoặc trái phiếu có biến động thấp.
Khung thời gian tốt nhất là giai đoạn giao nhau giữa phiên giao dịch châu Âu và Mỹ, lúc này tính thanh khoản tốt nhất, bộ lọc khối lượng hiệu quả nhất. Phiên châu Á do khối lượng thấp sẽ làm giảm chất lượng tín hiệu.
Cảnh báo rủi ro: Thua lỗ liên tiếp là mối đe dọa lớn nhất
Dữ liệu backtest cho thấy chiến lược này có rủi ro thua lỗ liên tiếp, đặc biệt trong thị trường đi ngang dao động. RSI 8 kỳ quá nhạy, dễ bị cắt lỗ nhiều lần trong dao động ngang.
Khuyến nghị mức rủi ro đơn lẻ không vượt quá 2% tài khoản, và tạm dừng giao dịch sau 3 lần cắt lỗ liên tiếp. Quá khứ không đảm bảo lợi nhuận trong tương lai, giao dịch thực tế yêu cầu quản lý vốn nghiêm ngặt và kiểm soát tâm lý.
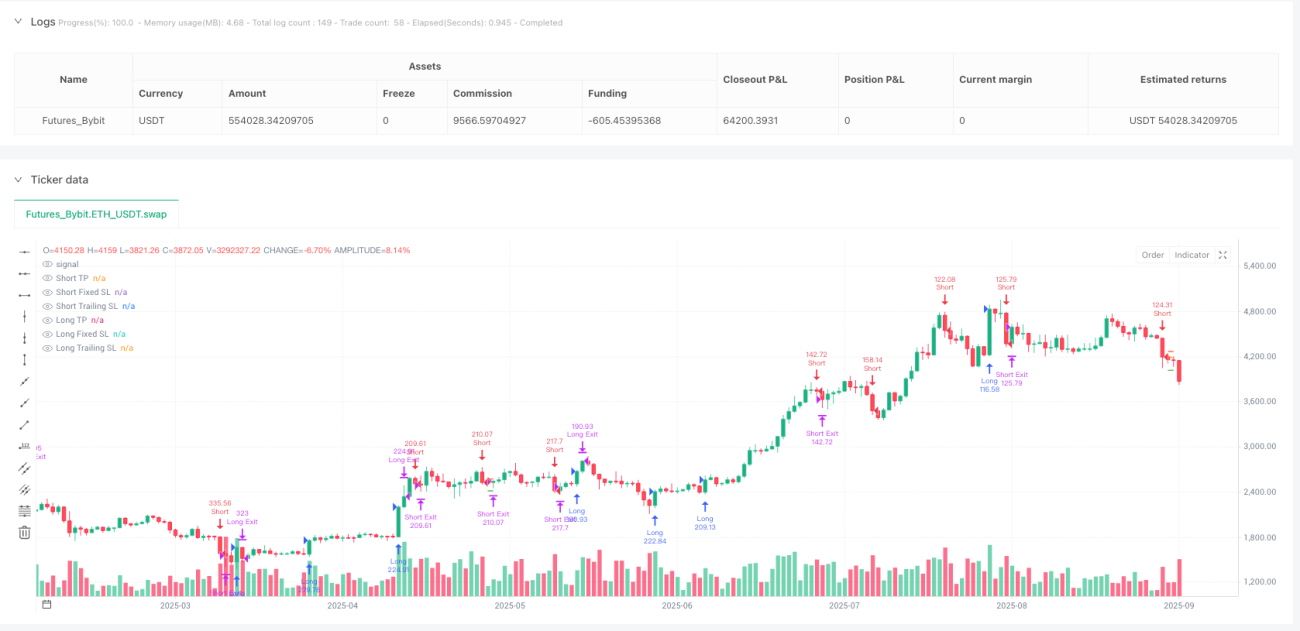
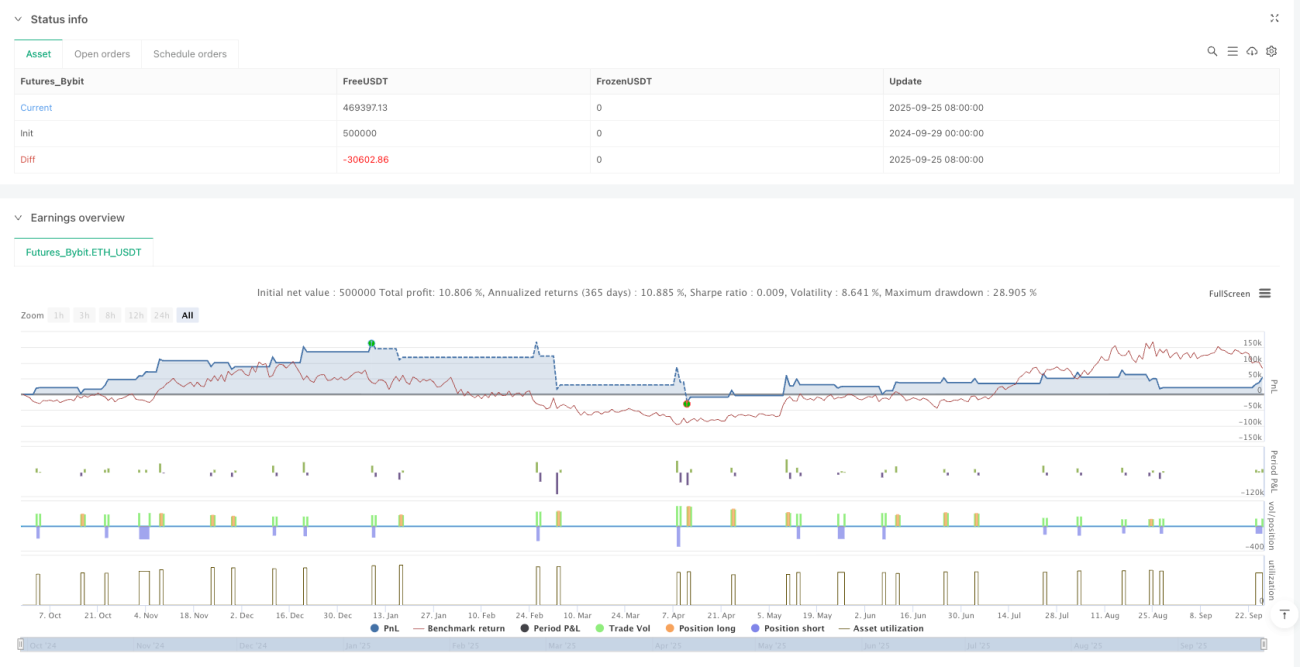
/*backtest
start: 2024-09-29 00:00:00
end: 2025-09-26 08:00:00
period: 1d
basePeriod: 1d
exchanges: [{"eid":"Futures_Bybit","currency":"ETH_USDT","balance":500000}]
*/

// This Pine Script® code is subject to the terms of the Mozilla Public License 2.0 at https://mozilla.org/MPL/2.0/
// © MonkeyPhone

//@version=5- 1