Chiến lược chu kỳ halving Bitcoin

Chiến lược chu kỳ halving: Dữ liệu lịch sử cho thấy tỷ suất lợi nhuận trung bình vượt quá 1000%
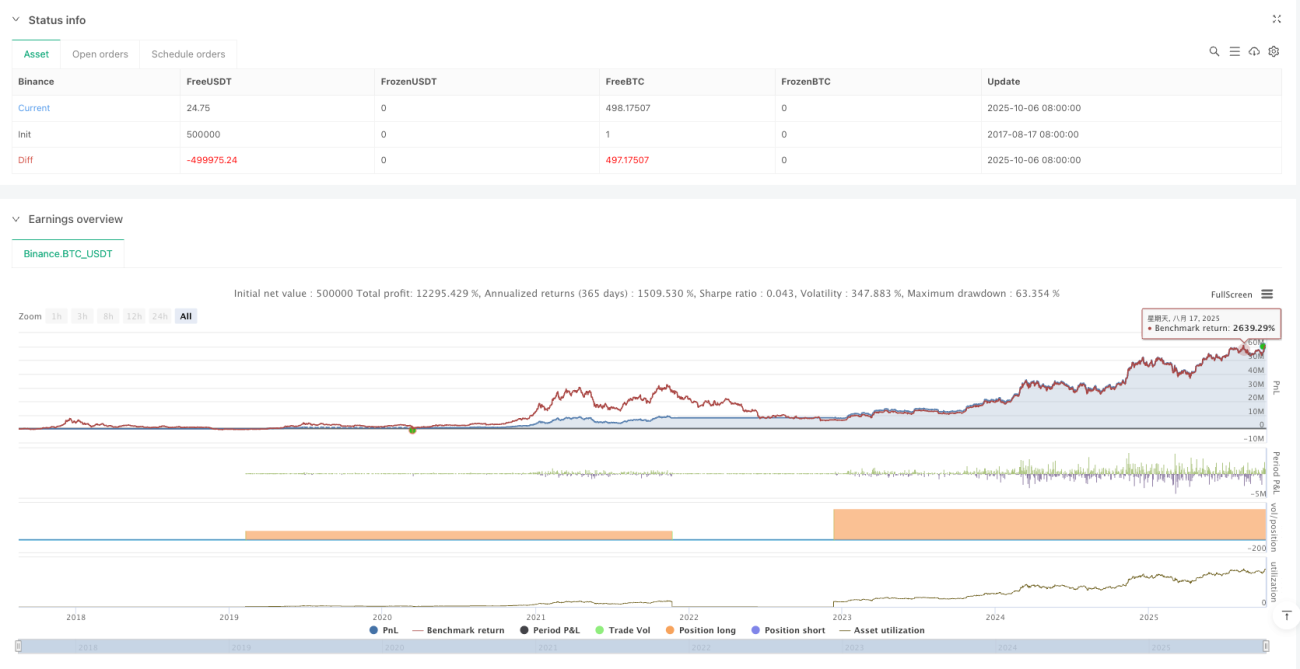
Đây không phải là một chiến lược phân tích kỹ thuật khác, mà là một khuôn khổ đầu tư dài hạn dựa trên chu kỳ halving 4 năm của Bitcoin. Dữ liệu kiểm tra ngược cho thấy: Nếu thực hiện mua bán chính xác theo thời điểm halving, lợi nhuận tối đa của một chu kỳ có thể lên tới hơn 2000%. Nhưng đừng vội phấn khích, chiến lược này đòi hỏi sức mạnh thực thi cực kỳ cao và khả năng chịu rủi ro lớn.
Logic cốt lõi rất đơn giản và trực tiếp: Mua vào khi halving, chốt lời theo từng đợt sau 40-80 tuần, và tái lập vị thế sau 135 tuần. Nghe thì dễ, nhưng thực hiện đòi hỏi ý chí thép.
Khung vận hành ba giai đoạn: Lựa chọn thời điểm chính xác hơn so với DCA truyền thống
Giai đoạn 1: Giai đoạn mua vào halving (0-40 tuần)
Xây dựng vị thế ngay lập tức sau khi sự kiện halving xảy ra, đây là điểm vào chính của toàn bộ chiến lược. Dữ liệu lịch sử cho thấy, 40 tuần sau halving là thời kỳ tích lũy tốt nhất, khi tâm lý thị trường thường chưa phản ứng hoàn toàn với tác động của việc giảm nguồn cung.
Giai đoạn 2: Giai đoạn chốt lời (40-80 tuần)
40-80 tuần sau halving là cửa sổ vàng lịch sử cho sự bùng nổ giá Bitcoin. Sau halving năm 2016, sau 78 tuần Bitcoin đã tăng hơn 3000%; sau halving năm 2020 cũng tương tự. Khoảng thời gian này không phải là suy đoán, mà là suy luận toán học dựa trên cơ bản cung cầu.
Giai đoạn 3: Giai đoạn xây dựng vị thế thị trường gấu (sau 135 tuần)
Sau 135 tuần kể từ halving, thường bước vào thị trường gấu sâu, lúc này khởi động chiến lược DCA. Lựa chọn thời điểm này tốt hơn so với DCA mù quáng vì tránh được các khoản đầu tư vô hiệu ở đỉnh thị trường bò.
Kiểm soát rủi ro: Không phải chiến lược thắng chắc, cần kỷ luật nghiêm ngặt
Rủi ro lớn nhất: Không đủ sức mạnh thực thi
Kẻ thù lớn nhất của chiến lược không phải là biến động thị trường, mà là bản chất con người. Mua khi halving đòi hỏi hành động ngược chiều khi thị trường bi quan, chốt lời cần giữ bình tĩnh trong cơn cuồng nhiệt. Lịch sử cho thấy 90% người không thể thực hiện trọn vẹn.
Yêu cầu quản lý vốn
Khuyến nghị mỗi lần đầu tư không quá 20% tổng tài sản, vì một chu kỳ có thể đối mặt với mức sụt giảm hơn 80%. Thị trường gấu năm 2018 đã giảm từ 20.000 USD xuống 3.200 USD, ngay cả khi mua ở thời điểm "đúng" cũng phải chịu khoản lỗ thả nổi rất lớn.
Rủi ro thay đổi môi trường thị trường
Chiến lược dựa trên dữ liệu 3 chu kỳ hoàn chỉnh trong lịch sử, nhưng thị trường Bitcoin đang trưởng thành. Dòng vốn tổ chức, sự chấp thuận ETF và các yếu tố khác có thể thay đổi quy luật chu kỳ truyền thống. Hiệu suất trong quá khứ không đảm bảo lợi nhuận trong tương lai, đây không phải lời nói suông.
Thiết lập tham số: Dựa trên mô hình toán học, không phải phán đoán chủ quan
Điểm bắt đầu chốt lời 40 tuần: Dựa trên tính toán điểm cân bằng cung cầu lịch sử sau halving, chốt lời quá sớm có thể bỏ lỡ sóng chính, quá muộn có thể bị kẹt ở đỉnh.
Điểm kết thúc chốt lời 80 tuần: Dữ liệu lịch sử cho thấy 80 tuần sau halving là khoảng thời gian có xác suất cao hình thành đỉnh giá, lúc này phải bắt đầu giảm vị thế theo từng đợt, đừng tham lam phần tăng cuối cùng.
Khởi động DCA sau 135 tuần: Giải pháp thống kê tối ưu cho vùng đáy thị trường gấu, lúc này bắt đầu DCA có tỷ lệ rủi ro/lợi nhuận tốt nhất.
Lời khuyên thực tế: Phù hợp với nhà đầu tư dài hạn, không phù hợp với giao dịch ngắn hạn
Chiến lược này phù hợp với vốn có chu kỳ đầu tư từ 5 năm trở lên, không phù hợp với những người cần tiền gấp hoặc khả năng chịu rủi ro thấp. Một chu kỳ đơn lẻ cần chịu đựng 2-3 năm lỗ thả nổi, áp lực tâm lý rất lớn.
Tỷ lệ thắng của chiến lược không nằm ở việc dự đoán giá ngắn hạn, mà ở việc nắm bắt chu kỳ cung cầu dài hạn. Halving Bitcoin là sự kiện chắc chắn, nhưng thời gian và biên độ phản ứng của giá vẫn có sự không chắc chắn.
Lưu ý quan trọng: Đây là chiến lược đầu tư rủi ro cao, có khả năng mất toàn bộ vốn gốc. Dữ liệu kiểm tra ngược lịch sử không đảm bảo lợi nhuận trong tương lai, trước khi đầu tư hãy đánh giá đầy đủ khả năng chịu rủi ro của bản thân.
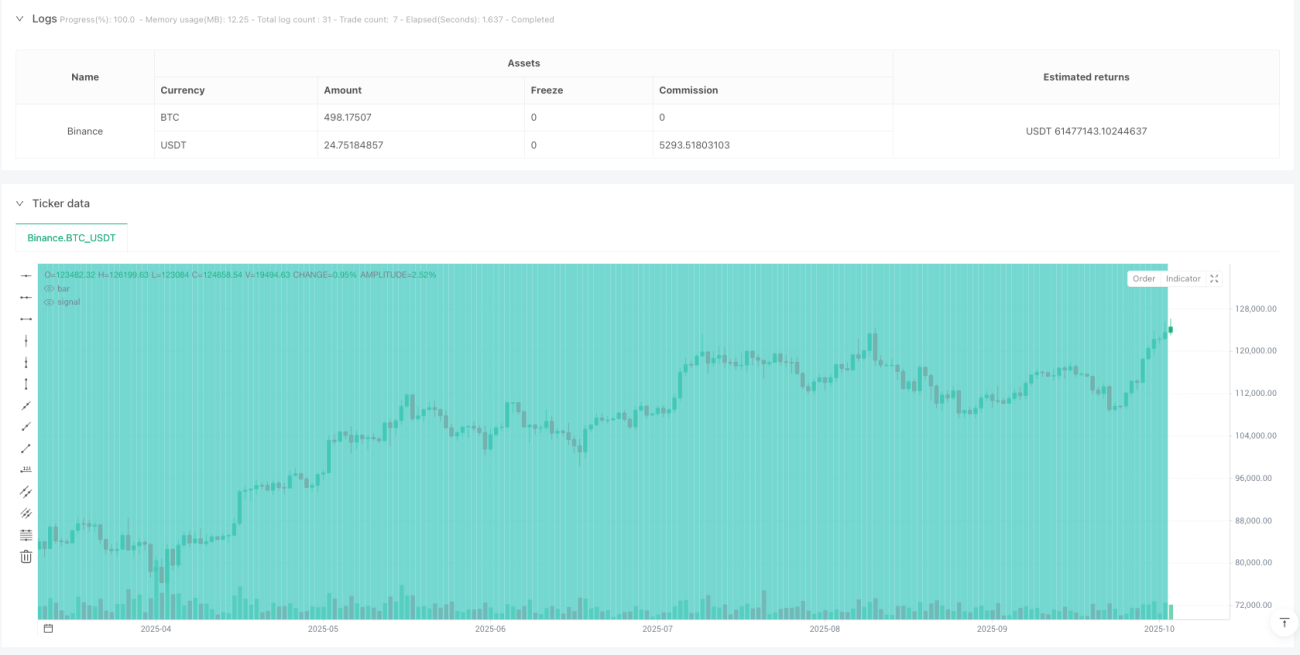
/*backtest
start: 2017-08-17 08:00:00
end: 2025-10-07 08:00:00
period: 1d
basePeriod: 1d
exchanges: [{"eid":"Binance","currency":"BTC_USDT","balance":500000}]
*/

//@version=6
strategy(title='Bitcoin Halving Cycle Profit - Backtesting', shorttitle='BTC Halv', overlay=true, default_qty_type=strategy.percent_of_equity, default_qty_value=100, initial_capital=10000, commission_type=strategy.commission.percent, commission_value=0.1)

// ════════════════════════════════════════════════════════════════════════════════════════════════- 1