Chiến lược Bộ dao động trơn hai cực

🎯 Đây là chiến lược thần thánh gì vậy?
Bạn có biết không? Chiến lược này giống như lắp một "máy dò cảm xúc" cho thị trường! 📡 Nó sử dụng bộ dao động trơn tru hai cực để cảm nhận "vui buồn" của thị trường, khi thị trường quá hưng phấn (quá mua) hoặc quá chán nản (quá bán), nó sẽ phát tín hiệu giao dịch. Lưu ý quan trọng! Đây không phải bộ dao động thông thường, mà là phiên bản cao cấp đã qua "xử lý đẹp hai lần", có thể lọc hiệu quả nhiễu thị trường, giúp bạn nhìn rõ hướng đi thực sự của xu hướng.
💡 Tiết lộ nguyên lý hoạt động
Hãy tưởng tượng, chiến lược này giống như một "nhiệt kế thị trường" siêu nhạy 🌡️. Đầu tiên, nó tính toán mức độ lệch giá khỏi đường trung bình động 25 chu kỳ, sau đó chuẩn hóa (giống như quy đổi chiều cao của người khác nhau về tỷ lệ chuẩn). Tiếp theo là quá trình "làm mịn kép" quan trọng, giống như dùng bộ lọc làm đẹp hai lần liên tiếp cho bức ảnh, giúp tín hiệu trở nên rõ ràng và đáng tin cậy hơn. Khi bộ dao động vượt qua ngưỡng đã đặt, chiến lược sẽ hành động dứt khoát!
⚡ Siêu năng lực của chiến lược này
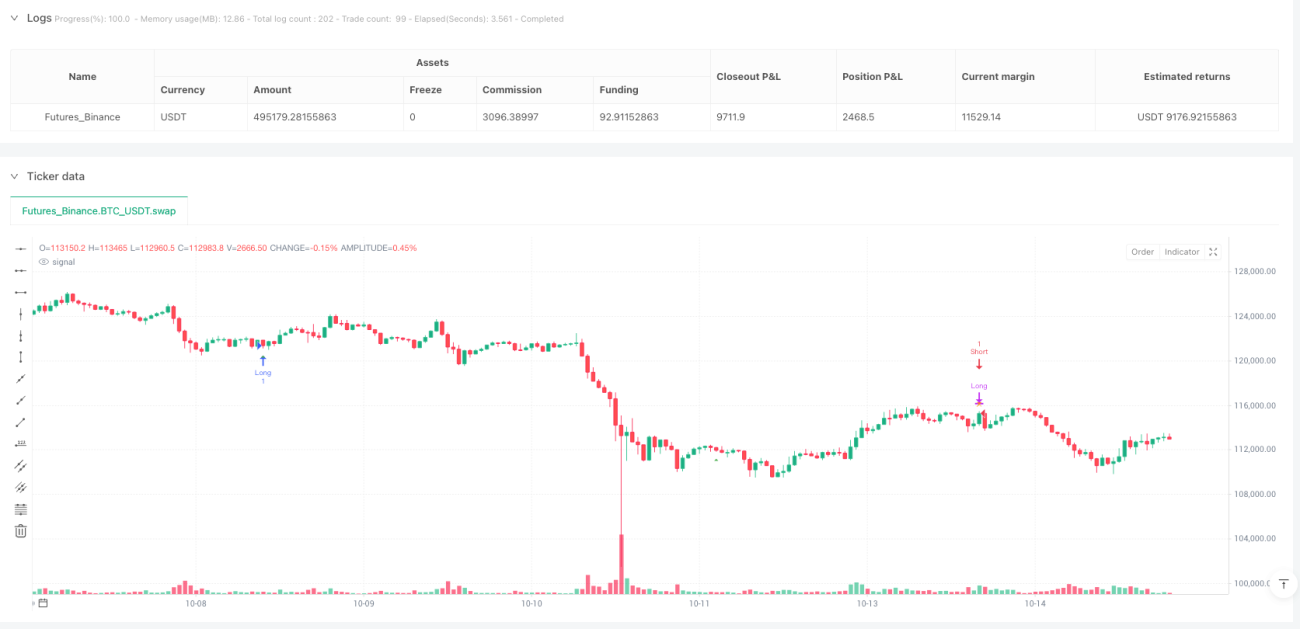
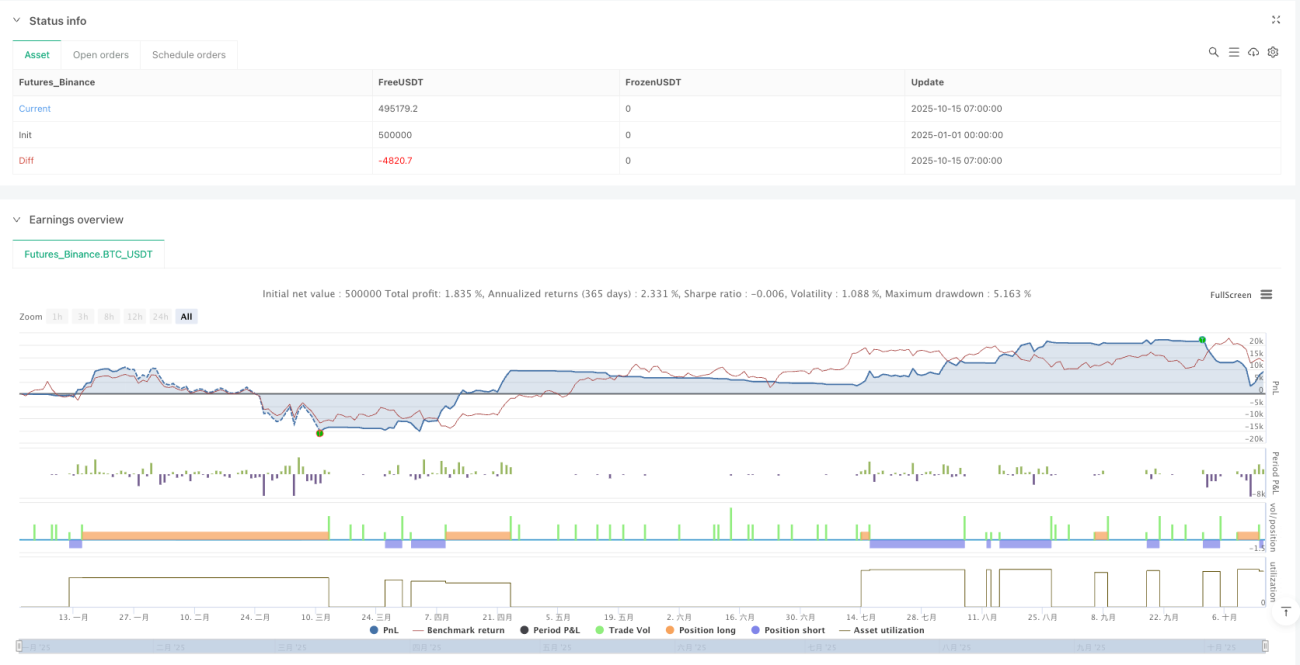
Hướng dẫn tránh bẫy đây! Điểm mạnh nhất của chiến lược này là cơ chế "đóng lệnh khi có tín hiệu ngược" - thông minh như khi lái xe thấy đèn đỏ thì lập tức phanh! 🚦 Khi xuất hiện tín hiệu ngược lại, chiến lược sẽ ngay lập tức đóng lệnh, không cố thủ đến cùng. Đồng thời, có thêm cơ chế dừng lỗ cố định 5 chu kỳ, giống như thêm một "túi khí an toàn" cho vốn của bạn. Đặc biệt nhất, nó còn được tích hợp đầy đủ chức năng thống kê giao dịch, giúp bạn nắm bắt hiệu suất chiến lược bất cứ lúc nào!
🚨 Không thể thiếu lưu ý rủi ro
Lưu ý quan trọng! Mặc dù chiến lược này rất xuất sắc, nhưng không phải vạn năng. Trong thị trường có xu hướng mạnh, bộ dao động có thể "đi lạc", giống như dùng định vị trong thành phố trên đường cao tốc vậy. Ngưỡng cố định có thể không phù hợp trong các môi trường thị trường khác nhau, cần bạn linh hoạt điều chỉnh theo tình hình thực tế. Hãy nhớ, bất kỳ chiến lược nào cũng cần kết hợp với quản lý rủi ro tốt, đừng bỏ tất cả trứng vào một giỏ!
- 1