
Bạn có biết không? Chiến lược này giống như là làm cho các biểu đồ tròn nhảy trên cây cân bằng! Nó biến các biểu đồ K thông thường thành các biểu đồ Heiken Ashi mịn mịn hơn, và sau đó kết hợp với các biểu đồ Ichimoku với các đường chuẩn, nó là “trượt tuyết hai người” trong lĩnh vực phân tích kỹ thuật.
Điểm mấu chốt của chiến lược này là “hệ thống lọc ba lần”, nghiêm ngặt như khi bạn chọn đối tượng đo tim! Đầu tiên, Heiken Ashi cần phải đứng bên phải của đường chuẩn Ichimoku (đây là ngưỡng cơ bản); tiếp theo, 200 chu kỳ EMA đảm bảo bạn đi theo xu hướng lớn (đừng đi ngược dòng); và cuối cùng, Ichimoku quay lưng với bộ lọc để đảm bảo hướng động lượng đúng (đánh tránh lỗ phá vỡ giả).
Điều này cũng giống như lái xe: đèn xanh sáng ((HA), đường tốt ((Trend Filter), và không có xe chạy ngược phía trước ((Trở lại xác nhận)).
Hướng dẫn tránh hố đã đến! Điểm thông minh nhất trong chiến lược này là sử dụng ATR để thiết lập điểm dừng lỗ. Nó sẽ tự động điều chỉnh theo biến động của thị trường, giống như hệ thống du hành tự động của xe hơi.
Hơn thế nữa, nó cũng sử dụng nhiều khung thời gian: ATR trong khung thời gian cao được sử dụng để dừng lỗ (để lợi nhuận chạy hết sức) và ATR trong khung thời gian thấp được sử dụng để dừng lỗ (để bảo vệ tài chính khỏi lỗ nhanh chóng).
Chiến lược này đặc biệt phù hợp với môi trường thị trường có xu hướng rõ ràng. Khi thị trường bị dao động ngang, nên chờ đợi tạm thời, vì Heiken Ashi dễ tạo ra tín hiệu giả trong thị trường biến động. Kịch bản sử dụng tốt nhất là biểu đồ 4 giờ hoặc chu kỳ của các cặp tiền tệ chính, đặc biệt là trong giai đoạn xác nhận xu hướng sau khi phát hành dữ liệu kinh tế quan trọng.
Hãy nhớ rằng, không có chiến lược nào là toàn năng! Chiến lược này có sức mạnh trong việc nắm bắt xu hướng trung và dài hạn, và nếu bạn là một người thích giao dịch đường ngắn, bạn có thể cần phải điều chỉnh các tham số hoặc tìm kiếm các chiến lược khác.
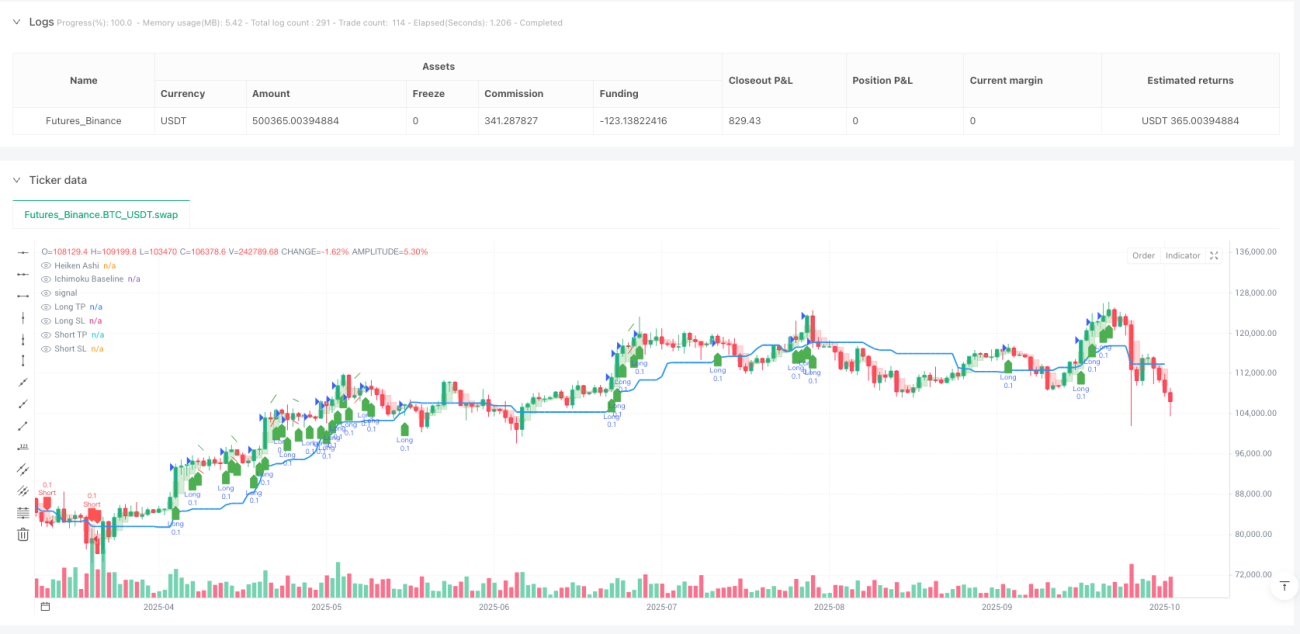
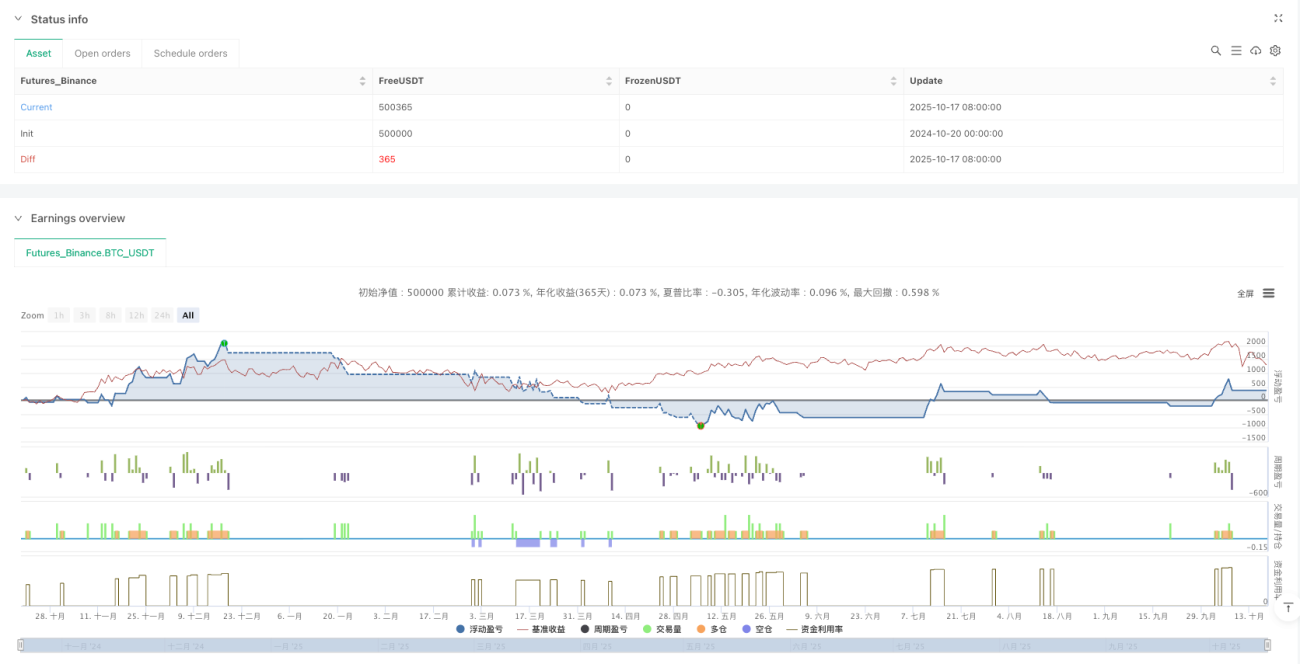
/*backtest
start: 2024-10-20 00:00:00
end: 2025-10-18 08:00:00
period: 1d
basePeriod: 1d
exchanges: [{"eid":"Futures_Binance","currency":"BTC_USDT","balance":500000}]
*/
// This Pine Script® code is subject to the terms of the Mozilla Public License 2.0 at https://mozilla.org/MPL/2.0/
// © MahdiSalari8
//@version=6
strategy("Heiken Ashi Bas", overlay=true,
default_qty_type=strategy.fixed,
default_qty_value=0.1,
commission_type=strategy.commission.percent,
commission_value=0.07,
initial_capital=10000000,
pyramiding=0) // Changed to 0
// Inputs
useTrendFilter = input.bool(true, "Use 200 EMA Trend Filter", group="Filters")
showSignals = input.bool(true, "Show Buy/Sell Signals", group="Visuals")
showEma = input.bool(false, "Show 200 EMA", group="Visuals")
atrPeriod = input.int(14, "ATR Period", minval=1, group="Risk Management")
htf = input.timeframe("5", "Higher Timeframe for TP", group="Timeframes")
ltf = input.timeframe("1", "Lower Timeframe for SL", group="Timeframes")
tpMultiplier = input.float(2.0, "TP Multiplier", minval=0.1, group="Risk Management")
slMultiplier = input.float(1.0, "SL Multiplier", minval=0.1, group="Risk Management")
// Ichimoku Divergence Settings
useDivergenceFilter = input.bool(true, "Use Ichimoku Divergence Filter", group="Ichimoku Divergence")
showDivergenceLine = input.bool(true, "Show Divergence Line", group="Ichimoku Divergence")
divergenceLookback = input.int(2, "Divergence Lookback (bars)", minval=1, maxval=20, group="Ichimoku Divergence")
divergenceLineWidth = input.int(5, "Divergence Line Width", minval=1, maxval=5, group="Ichimoku Divergence")
// Heiken Ashi Calculation
var float haOpen = na
var float haClose = na
var float haHigh = na
var float haLow = na
haClose := (open + high + low + close) / 4
haOpen := na(haOpen[1]) ? (open + close) / 2 : (haOpen[1] + haClose[1]) / 2
haHigh := math.max(high, math.max(haOpen, haClose))
haLow := math.min(low, math.min(haOpen, haClose))
// Ichimoku Baseline (Kijun-sen)
kijunPeriod = 26
kijunSen = (ta.highest(high, kijunPeriod) + ta.lowest(low, kijunPeriod)) / 2
// Ichimoku Baseline Divergence Calculation
currentBaseline = kijunSen
pastBaseline = kijunSen[divergenceLookback]
// Calculate slope (divergence)
baselineSlope = (currentBaseline - pastBaseline) / divergenceLookback
// Determine bullish/bearish divergence (exclude when slope is 0)
bullishDivergence = baselineSlope > 0
bearishDivergence = baselineSlope < 0
slopeIsZero = baselineSlope == 0
// Trend Filter (200 EMA)
ema200 = ta.ema(close, 200)
// ATR Calculation for different timeframes
htfAtr = request.security(syminfo.tickerid, htf, ta.atr(atrPeriod))
ltfAtr = request.security(syminfo.tickerid, ltf, ta.atr(atrPeriod))
// Enhanced Entry Conditions with Divergence Filter (exclude when slope is 0)
longCondition = haClose > kijunSen and
haClose[1] >= kijunSen[1] and
haClose > haOpen and
(haHigh - haClose) >= (haClose - haOpen) * 0.3 and
(not useTrendFilter or close > ema200) and
(not useDivergenceFilter or (bullishDivergence and not slopeIsZero))
shortCondition = haClose < kijunSen and
haClose[1] <= kijunSen[1] and
haClose < haOpen and
(haClose - haLow) >= (haOpen - haClose) * 0.3 and
(not useTrendFilter or close < ema200) and
(not useDivergenceFilter or (bearishDivergence and not slopeIsZero))
// Dynamic TP/SL based on ATR
longTp = close + (htfAtr * tpMultiplier)
longSl = close - (ltfAtr * slMultiplier)
shortTp = close - (htfAtr * tpMultiplier)
shortSl = close + (ltfAtr * slMultiplier)
// Strategy Execution
if (longCondition)
strategy.entry("Long", strategy.long)
strategy.exit("Long Exit", "Long", limit=longTp, stop=longSl)
if (shortCondition)
strategy.entry("Short", strategy.short)
strategy.exit("Short Exit", "Short", limit=shortTp, stop=shortSl)
// Plotting
plot(kijunSen, color=color.blue, title="Ichimoku Baseline", linewidth=2, display=display.all)
// Plot Divergence Line (gray when slope is 0)
plot(showEma ? ema200 : na, color=color.purple, title="200 EMA", linewidth=1, display=display.all)
// Heiken Ashi Candles with 25% opacity
candleColor = haClose > haOpen ? color.new(color.green, 75) : color.new(color.red, 75)
plotcandle(haOpen, haHigh, haLow, haClose, title="Heiken Ashi", color=candleColor, wickcolor=candleColor, bordercolor=candleColor, display=display.all)
// Plot Buy/Sell Signals with labelup/labeldown shapes
plotshape(showSignals and longCondition, style=shape.labelup, location=location.belowbar, color=color.new(color.green, 0), size=size.small, title="Buy Signal", display=display.all)
plotshape(showSignals and shortCondition, style=shape.labeldown, location=location.abovebar, color=color.new(color.red, 0), size=size.small, title="Sell Signal", display=display.all)
// Plot TP/SL levels - TP as lines with breaks, SL hidden by default
plot(strategy.position_size > 0 ? longTp : na, "Long TP", color=color.green, style=plot.style_linebr, linewidth=1, display=display.all)
plot(strategy.position_size > 0 ? longSl : na, "Long SL", color=color.red, style=plot.style_linebr, linewidth=1, display=display.none)
plot(strategy.position_size < 0 ? shortTp : na, "Short TP", color=color.green, style=plot.style_linebr, linewidth=1, display=display.all)
plot(strategy.position_size < 0 ? shortSl : na, "Short SL", color=color.red, style=plot.style_linebr, linewidth=1, display=display.none)
// Alerts
alertcondition(longCondition, "Long Signal", "HA Cross Above Kijun-sen with Bullish Divergence")
alertcondition(shortCondition, "Short Signal", "HA Cross Below Kijun-sen with Bearish Divergence")