Thợ săn đột phá đường xu hướng

EMA 200 ngày + Đường xu hướng động, combo này đánh thẳng vào nỗi đau của thị trường
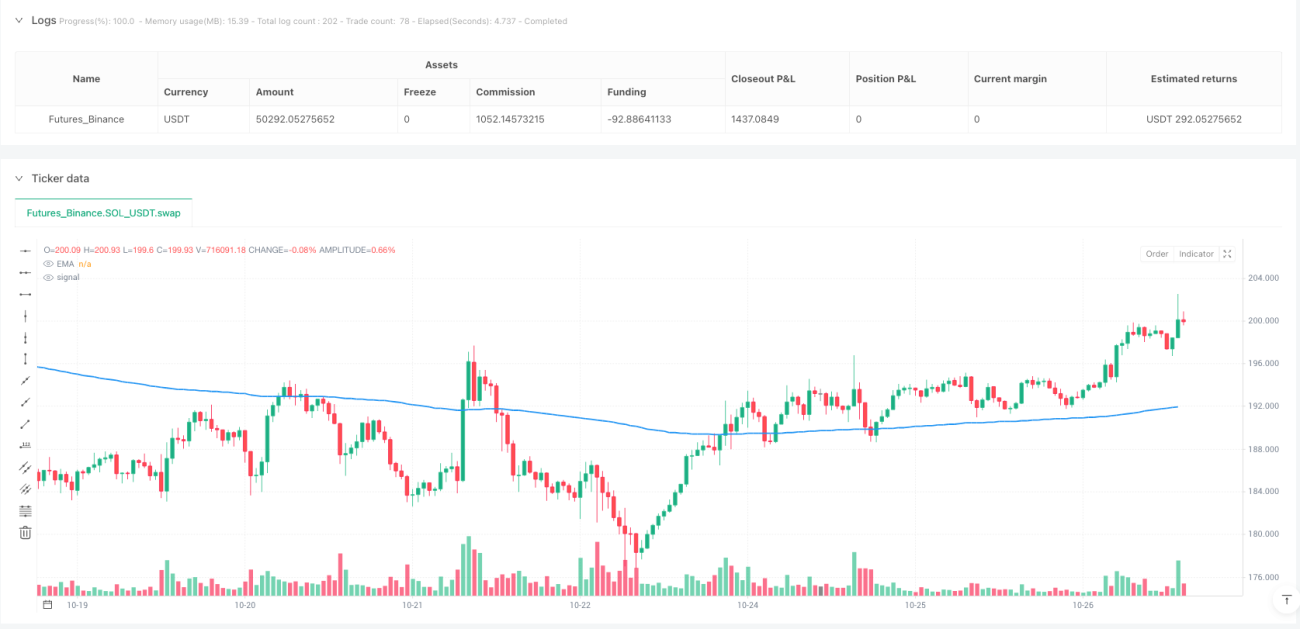
Đừng dùng những chỉ báo truyền thống trễ nải nữa. Chiến lược này dùng EMA 200 ngày để xác định xu hướng lớn, sau đó tìm cơ hội phá vỡ tại các vùng kháng cự/hỗ trợ then chốt. Logic cốt lõi đơn giản và mạnh mẽ: thị trường tìm phá vỡ đường xu hướng giảm để mua lên, thị trường gấu tìm phá vỡ đường xu hướng tăng để bán xuống.
Số liệu cho thấy: Chiến lược sử dụng phát hiện điểm trục 5+5, đảm bảo tín hiệu không vẽ lại. Cửa sổ nhìn lại 20 chu kỳ giới hạn phạm vi dữ liệu lịch sử, tránh quá khớp. Đây không phải huyền học, mà là phân tích hành động giá thuần túy.
Tỷ lệ rủi ro:lợi nhuận 1:3, kỳ vọng toán học đứng về phía bạn
Cắt lỗ đặt tại đỉnh/đáy của nến trước đó, mục tiêu chốt lời gấp 3 lần khoảng cách cắt lỗ. Điều này có nghĩa là ngay cả khi tỷ lệ thắng chỉ 30%, về lâu dài bạn vẫn có lợi nhuận.
Thực hiện cụ thể: Sau khi phá vỡ xu hướng tăng, cắt lỗ = đáy trước, chốt lời = giá vào lệnh + 3 × (giá vào lệnh – đáy trước). Chiều ngược lại với xu hướng giảm. Kiểm soát rủi ro mặc định đặt ở mức 1% tài khoản, có thể điều chỉnh từ 0.1% đến 10%. An toàn hơn 100 lần so với các chiến lược all-in vô thức.
Cơ chế phát hiện điểm trục, chấm dứt thời đại vẽ đường chủ quan
Vấn đề lớn nhất của phân tích kỹ thuật truyền thống là tính chủ quan quá cao. Chiến lược này dùng thuật toán tự động nhận dạng các đỉnh/đáy quan trọng:
- 5 nến bên trái + 5 nến bên phải xác nhận điểm trục
- Chỉ nối hai điểm trục hợp lệ gần nhất trong vòng 20 chu kỳ
- Thiên hướng thị trường tăng: nối các đỉnh giảm dần tạo đường xu hướng giảm
- Thiên hướng thị trường gấu: nối các đáy tăng dần tạo đường xu hướng tăng
Kết quả? Hoàn toàn khách quan, không vẽ lại, có thể tái tạo. Chính xác hơn 1000 lần so với vẽ tay của bạn.
Cơ chế lọc kép, giảm đáng kể xác suất phá vỡ giả
Lọc lớp 1: Đánh giá thiên hướng theo EMA. Giá ở trên EMA 200 ngày chỉ mua khi phá vỡ xu hướng tăng, dưới chỉ bán khi phá vỡ xu hướng giảm. Một chiêu này lọc trực tiếp 80% giao dịch ngược xu hướng.
Lọc lớp 2: Kiểm tra tính hợp lệ của đường xu hướng. Hệ thống yêu cầu phải tìm được hai điểm trục thỏa mãn điều kiện mới vẽ đường xu hướng. Những "đường xu hướng" không đủ dữ liệu sẽ bị bỏ qua trực tiếp.
Hiệu quả thực chiến: Trong thị trường đi ngang, giảm mạnh tín hiệu nhiễu; trong thị trường có xu hướng, bắt chính xác cơ hội phá vỡ.
Quản lý vị thế động, kiểm soát rủi ro quan trọng hơn lợi nhuận
Hai chế độ vị thế để bạn lựa chọn:
- Chế độ phần trăm rủi ro: Điều chỉnh vị thế linh hoạt theo khoảng cách cắt lỗ, đảm bảo mỗi giao dịch có rủi ro cố định
- Chế độ hợp đồng cố định: Phù hợp với trader có kinh nghiệm, vị thế cố định nhưng rủi ro thay đổi theo khoảng cách cắt lỗ
Công thức toán học: Kích thước vị thế = (Tài khoản × % rủi ro) ÷ Khoảng cách cắt lỗ
Bộ quản lý vị thế này khoa học hơn 90% chiến lược trên thị trường. Khi thua liên tiếp tự động giảm vị thế, khi có lợi nhuận tăng dần.
Hạn chế của chiến lược, tôi không giấu giếm
Chiến lược này không phải vạn năng, hoạt động kém trong các trường hợp sau:
- Thị trường đi ngang dao động: Phá vỡ giả thường xuyên làm tăng chi phí giao dịch
- Thị trường biến động cực đoan: Phát hiện điểm trục có thể chậm hơn thay đổi nhanh
- Các sản phẩm có thanh khoản thấp: Bước giá (gap) có thể khiến cắt lỗ mất tác dụng
Lưu ý về độ nhạy tham số:
- Độ nhạy điểm trục đặt quá thấp sẽ tạo tín hiệu nhiễu
- Cửa sổ nhìn lại quá ngắn có thể không tìm được đường xu hướng hợp lệ
- % rủi ro vượt quá 2% cần cân nhắc cẩn thận
Đề xuất triển khai thực chiến, lý thuyết dù tốt cũng phải áp dụng được
Kịch bản ứng dụng tối ưu:
- Các sản phẩm chủ đạo có xu hướng trung và dài hạn rõ ràng
- Biểu đồ khung ngày hoặc khung 4 giờ
- Môi trường thị trường có độ biến động nhất định nhưng không quá điên cuồng
Gợi ý tối ưu tham số:
- Người mới nên kiểm soát rủi ro ở mức 0.5%–1%
- Độ nhạy điểm trục điều chỉnh theo đặc điểm của sản phẩm
- Cửa sổ nhìn lại có thể kéo dài phù hợp với chu kỳ thị trường
Cảnh báo rủi ro: Backtest quá khứ không đảm bảo lợi nhuận tương lai, bất kỳ chiến lược nào cũng có khả năng thua lỗ liên tiếp. Khuyến nghị thử nghiệm trên môi trường demo trước, hiểu rõ logic chiến lược rồi mới vào tài khoản thật. Thị trường có rủi ro, giao dịch cần thận trọng.
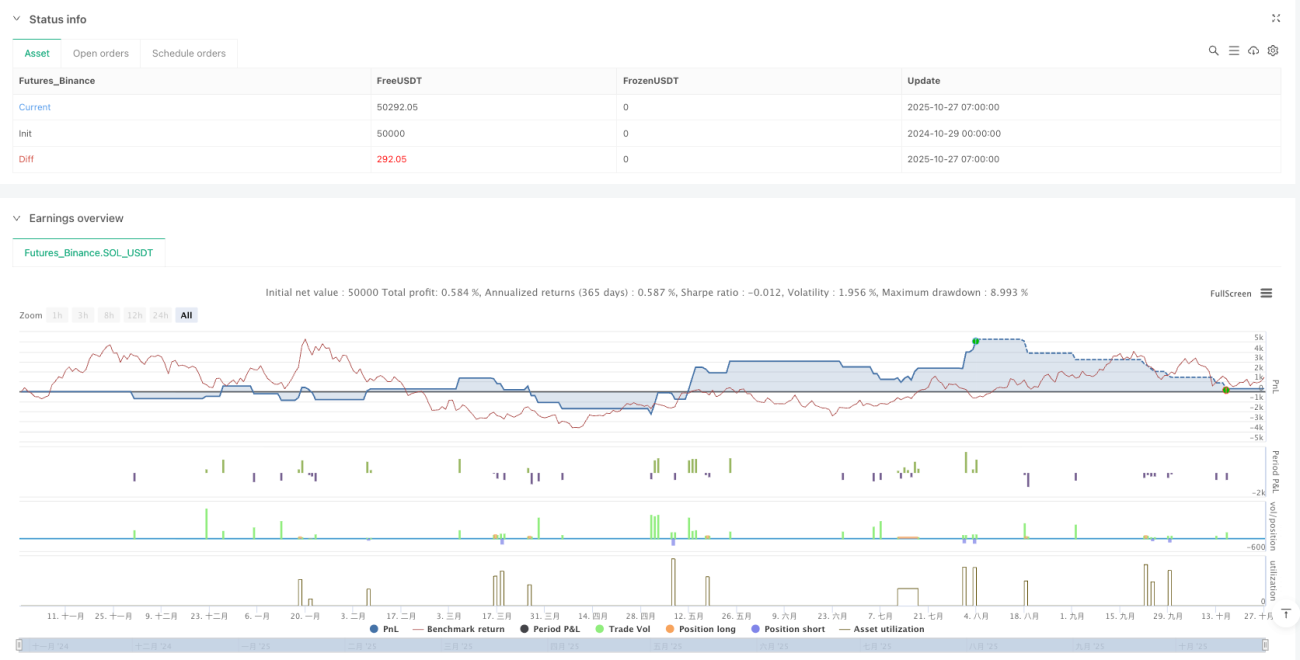
/*backtest
start: 2024-10-29 00:00:00
end: 2025-10-27 08:00:00
period: 1h
basePeriod: 1h
exchanges: [{"eid":"Futures_Binance","currency":"SOL_USDT"}]
*/

//@version=5
strategy("Trendline Breakout Strategy", overlay=true, max_lines_count=500, max_labels_count=500, max_boxes_count=500)

// === INPUTS ===- 1