Chiến lược săn lùng thanh khoản vàng

🎯 Chiến lược này thực sự làm gì?
Bạn có biết không? Trên thị trường có một nhóm "tiền thông minh" luôn thích đặt bẫy ở những vị trí quan trọng! Chiến lược này giống như một thợ săn giàu kinh nghiệm, chuyên nhận diện những cái bẫy đó và giao dịch ngược lại. Nói một cách đơn giản, khi giá cố tình "phá vỡ giả" các vùng hỗ trợ/kháng cự quan trọng rồi nhanh chóng kéo ngược trở lại, chúng ta sẽ vào lệnh theo dòng tiền lớn!
📊 Hé lộ hệ thống lọc ba lớp
Nhấn mạnh! Chiến lược này sử dụng ba lớp bảo vệ:
🔸 Bộ lọc xu hướng: EMA 200 chu kỳ giống như một tài xế già đời, cho bạn biết hiện tại đang đi lên dốc hay xuống dốc
🔸 Nhận diện vùng key: Tự động tìm ra các vùng hỗ trợ/kháng cự "tử địa" mà ai cũng phải tranh giành
🔸 Phát hiện quét thanh khoản: Bắt được những "động tác giả" mà dòng tiền lớn cố tình tạo ra
Giống như câu cá, bạn phải biết cá ở đâu, dùng mồi gì, và lúc nào thì kéo cần!
🎪 Sức hút kỳ diệu của quét thanh khoản
Hãy tưởng tượng: Bạn đang xếp hàng mua trà sữa, bỗng có người hét "Tặng miễn phí!" Mọi người đổ xô qua, nhưng hóa ra là giả, tuy nhiên người thông minh đã lợi dụng lúc hỗn loạn để chen lên phía trước.
Thị trường cũng vậy! Giá trước tiên "giả vờ" phá vỡ vùng hỗ trợ (quét lệnh stop loss), sau đó nhanh chóng quay trở lại – đây chính là thời điểm vào lệnh tốt nhất. Chiến lược thiết lập vùng đệm bằng 0,6 lần ATR để đảm bảo đó thực sự là "quét" chứ không phải phá vỡ thật.
⚡ Kiểm soát rủi ro: Tỷ lệ vàng 1:2
Hướng dẫn tránh bẫy: Nhiều người giao dịch giống như lái xe không thắt dây an toàn, chiến lược này bắt buộc áp dụng tỷ lệ rủi ro/lợi nhuận 1:2!
- Stop loss đặt dưới vùng key 0,5 lần ATR
- Take profit cách gấp đôi khoảng cách stop loss
- Dù chỉ có 40% tỷ lệ thắng, về lâu dài vẫn có lợi nhuận!
🚀 Mẹo ứng dụng thực tế
Chiến lược này phù hợp nhất với giao dịch vàng khung thời gian 15 phút, tại sao? Bởi vì thị trường vàng có thanh khoản tốt, hiện tượng phá vỡ giả rõ ràng, và khung 15 phút giúp lọc bớt nhiễu.
Hãy nhớ: Đừng tham lam! Chiến lược đã giúp bạn tìm được vị trí tốt, phần còn lại hãy để thị trường và thời gian quyết định~
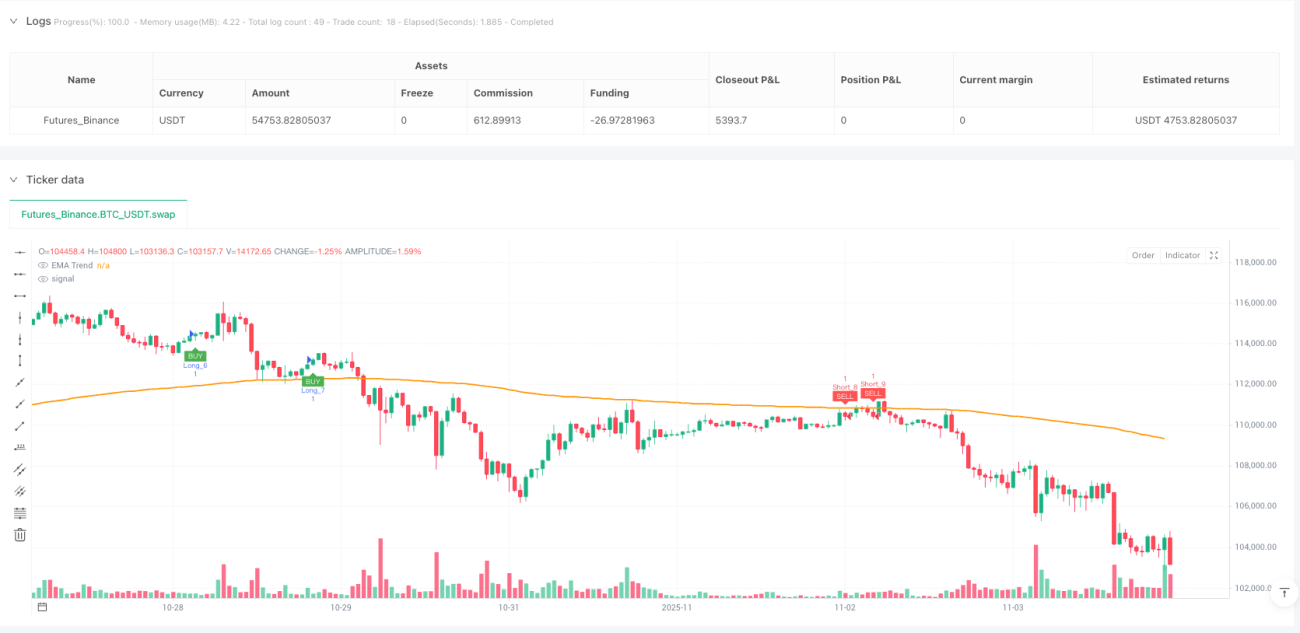
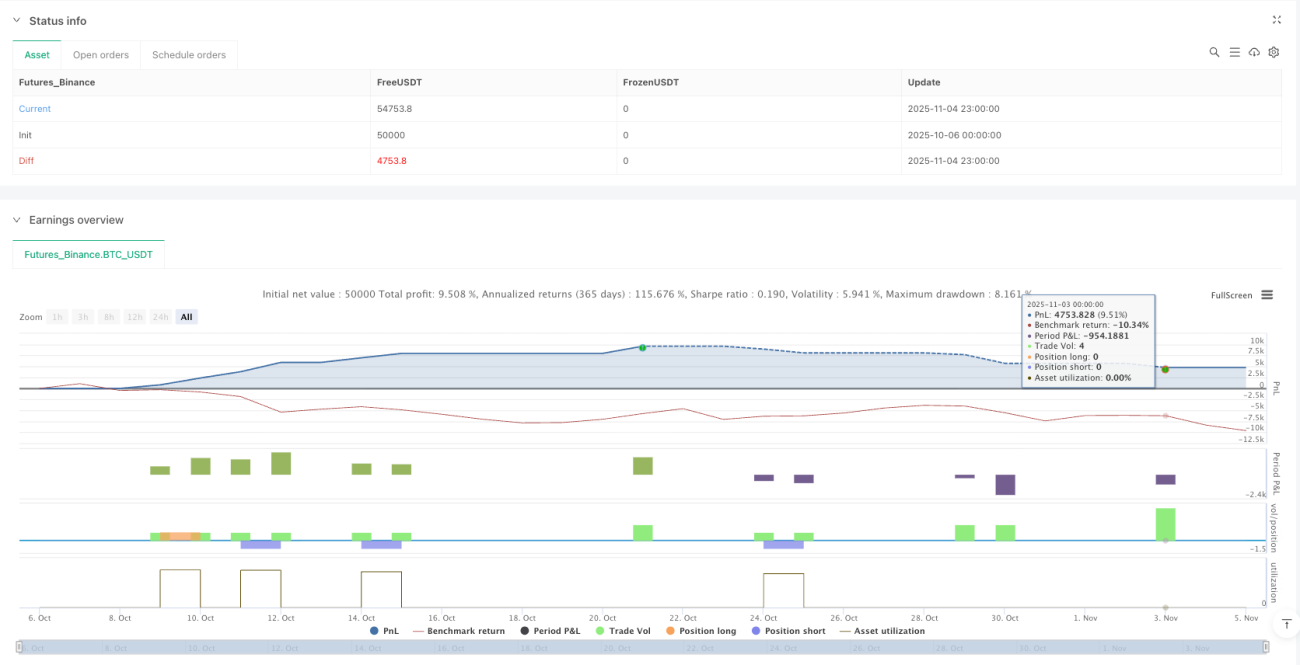
/*backtest
start: 2025-10-06 00:00:00
end: 2025-11-05 00:00:00
period: 1h
basePeriod: 1h
exchanges: [{"eid":"Futures_Binance","currency":"BTC_USDT"}]
*/

//@version=6
strategy("Gold 15m: Trend + S/R + Liquidity Sweep (RR 1:2)", overlay=true, default_qty_type=strategy.fixed, default_qty_value=1, commission_type=strategy.commission.percent, commission_value=0.0)

// ---------------------- INPUTS ----------------------- 1