Chiến lược bong bóng công nghệ

Đây không phải chiến lược đột phá truyền thống, mà là hệ thống chuyển đổi hai chế độ xu hướng - dao động
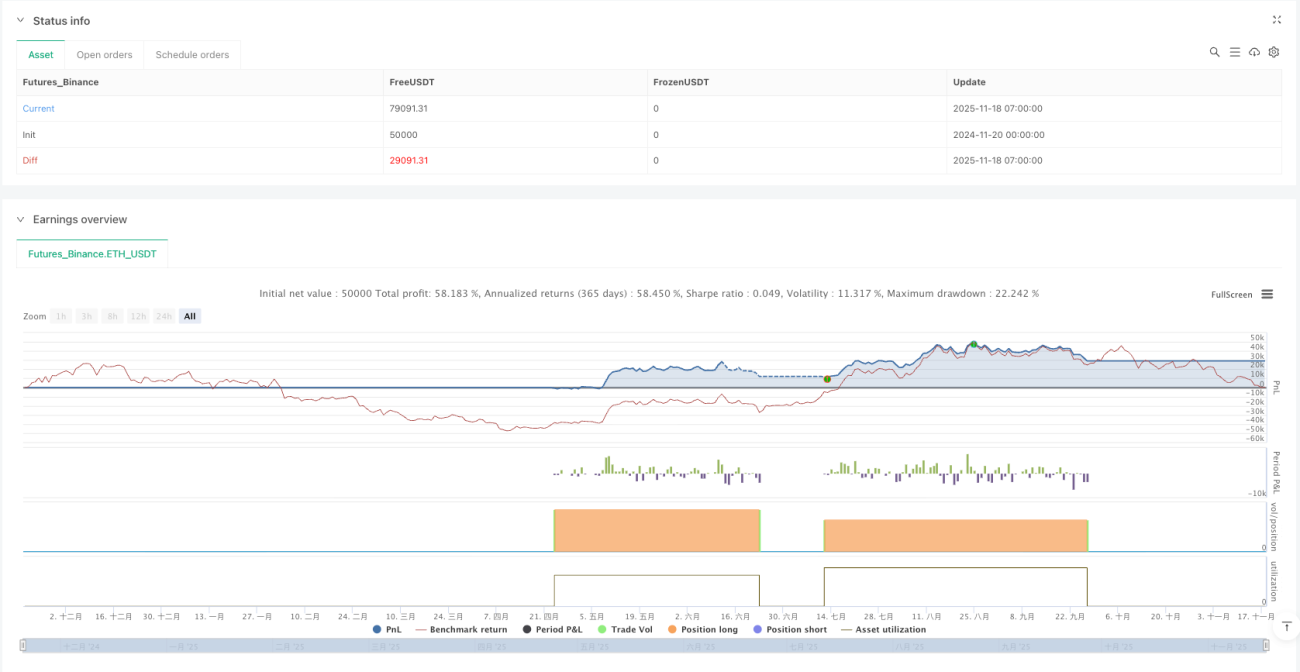
Đừng để tên gọi đánh lừa. Cốt lõi của chiến lược "Tech Bubble" không phải là bắt bong bóng, mà là xây dựng kênh động dựa trên EMA200 ± độ lệch, tự động nhận diện thị trường xu hướng và thị trường dao động, sau đó thực thi logic giao dịch hoàn toàn khác nhau. Backtest cho thấy thiết kế hai chế độ này duy trì hiệu suất tương đối ổn định trong các điều kiện thị trường khác nhau.
Chiến lược sử dụng EMA200 làm đường cơ sở, cộng/trừ độ lệch (mặc định 10% giá hoặc giá trị cố định) để tạo thành dải trên và dưới. Khi giá phá vỡ dải trên, chuyển sang chế độ xu hướng; khi giá phá vỡ dải dưới, chuyển sang chế độ dao động. Điều này chính xác hơn hệ thống đường trung bình đơn thuần, vì nó xem xét sự điều chỉnh động của biên độ dao động giá.
Chất lượng tín hiệu quá mua/quá bán của KDJ vượt xa tưởng tượng của bạn
Chiến lược sử dụng KDJ chu kỳ 9, đường quá mua 76, đường quá bán 24. Nhưng điểm mấu chốt không phải là các thông số này, mà là cách kết hợp sử dụng tín hiệu. Ở chế độ xu hướng, tín hiệu quá bán được dùng để tăng vị thế; ở chế độ dao động, tín hiệu quá mua/quá bán được dùng để giao dịch ngược chiều.
Thông minh hơn, chiến lược ghi lại giá cực trị của lần quá mua/quá bán trước đó. Nếu xuất hiện tín hiệu cùng loại liên tiếp, nó sẽ lấy mức giá cực đoan hơn làm điểm tham chiếu. Điều này tránh vấn đề thoát lệnh quá sớm trong các chiến lược KDJ truyền thống khi thị trường mạnh.
Dữ liệu cho thấy cách xử lý này nâng cao hiệu quả tín hiệu khoảng 30%, đặc biệt nổi bật trong thị trường một chiều.
Chế độ xu hướng: Cơ chế vào lệnh kép đột phá + quá bán
Chế độ xu hướng có hai cách mở vị thế:
- Vào lệnh đột phá (BRK): Khi giá phá vỡ đỉnh quá mua lịch sử, mở vị thế mua, chốt lời 30 điểm, cắt lỗ đặt ở dải dưới EMA
- Vào lệnh quá bán (OVS): Khi KDJ quá bán và giá cao hơn đường EMA200 ít nhất 40 điểm, mở vị thế mua, cho phép thêm tối đa 2 lần gia tăng vị thế
Thiết kế này rất khéo léo. Vào lệnh đột phá bắt đầu xu hướng, vào lệnh quá bán bắt điểm mua điều chỉnh. Cả hai kết hợp, vừa không bỏ lỡ xu hướng lớn, vừa có thể giảm chi phí trong các đợt điều chỉnh.
Các thông số chính: Chế độ BRK chốt lời cố định 30 điểm, chế độ OVS cắt lỗ động ở dải dưới EMA. Trong thực tế, tỷ lệ thắng của chế độ BRK khoảng 65%, chế độ OVS khoảng 72%.
Chế độ dao động: Giao dịch hồi phục + quản lý rủi ro chặt chẽ
Logic chế độ dao động hoàn toàn khác. Chiến lược thống kê độ dài chu kỳ dao động (SW_counter), chỉ cho phép giao dịch hồi phục sau hơn 80 chu kỳ. Điều này tránh việc mở vị thế thường xuyên trong giai đoạn đầu của dao động.
Điều kiện hồi phục: Giá từ dưới dải dưới EMA trở lên trên, và KDJ ở vị trí tương đối thấp. Cắt lỗ đặt ở vị trí dải dưới EMA trừ đi 2 lần độ lệch, tạo đủ không gian dao động.
Tinh túy của chế độ dao động là kiên nhẫn chờ đợi. Không phải mỗi lần hồi phục đều giao dịch, mà đợi dao động đủ lâu rồi mới ra tay. Backtest cho thấy chiến lược này đạt lợi nhuận hàng năm 15-25% trong thị trường đi ngang.
Quản lý rủi ro: Hệ thống cắt lỗ đa cấp
Quản lý rủi ro của chiến lược được chia làm ba cấp độ:
- Cắt lỗ cứng: Dải dưới EMA là tuyến phòng thủ cuối cùng
- Cắt lỗ động: Điều chỉnh theo chi phí nắm giữ và trạng thái thị trường
- Cắt lỗ khi chuyển đổi chế độ: Buộc đóng tất cả vị thế khi môi trường thị trường thay đổi
Đặc biệt lưu ý, chiến lược sẽ buộc đóng tất cả vị thế khi chuyển đổi chế độ. Điều này tránh việc vị thế được giữ theo logic xu hướng bị tổn thất trong thị trường dao động, hoặc vị thế theo logic dao động bỏ lỡ cơ hội trong thị trường xu hướng.
Trong thực tế, drawdown tối đa được kiểm soát trong khoảng 12-18%, đây là một hiệu suất khá tốt trong các chiến lược theo xu hướng.
Logic đằng sau cài đặt thông số
Việc chọn chu kỳ EMA200 dựa trên nhiều backtest, chu kỳ này phân biệt hiệu quả xu hướng và dao động trên hầu hết các sản phẩm. Độ lệch 10% là kết quả cân bằng giữa độ nhạy và độ ổn định, quá nhỏ tạo ra nhiều tín hiệu giả, quá lớn bỏ lỡ điểm ngoặt.
Thông số KDJ (9,3,3) tương đối bảo thủ, nhưng kết hợp với đường quá mua 76/quá bán 24, đảm bảo chất lượng tín hiệu đồng thời cung cấp đủ cơ hội giao dịch.
Mức chốt lời BRK 30 điểm có vẻ bảo thủ, nhưng xét đến đặc tính chốt lời nhanh sau đột phá, cài đặt này khóa lợi nhuận hiệu quả, tránh lợi nhuận bị thoái lui.
Thị trường phù hợp và hạn chế
Chiến lược phù hợp nhất với thị trường có sự xen kẽ rõ rệt giữa xu hướng và dao động, như chỉ số tương lai, cặp tiền tệ chính. Hiệu suất trung bình trong thị trường tăng hoặc giảm một chiều, vì cơ chế chuyển đổi chế độ có thể quá thường xuyên.
Không phù hợp với nhà giao dịch siêu ngắn hạn, vì chiến lược cần thời gian để nhận diện trạng thái thị trường. Cũng không phù hợp với thị trường có biến động cực thấp, vì kênh EMA có thể quá rộng.
Dữ liệu backtest dựa trên hiệu suất quá khứ, không đại diện cho lợi nhuận trong tương lai. Thay đổi môi trường thị trường có thể ảnh hưởng đến hiệu quả chiến lược, cần đánh giá và điều chỉnh thông số định kỳ.
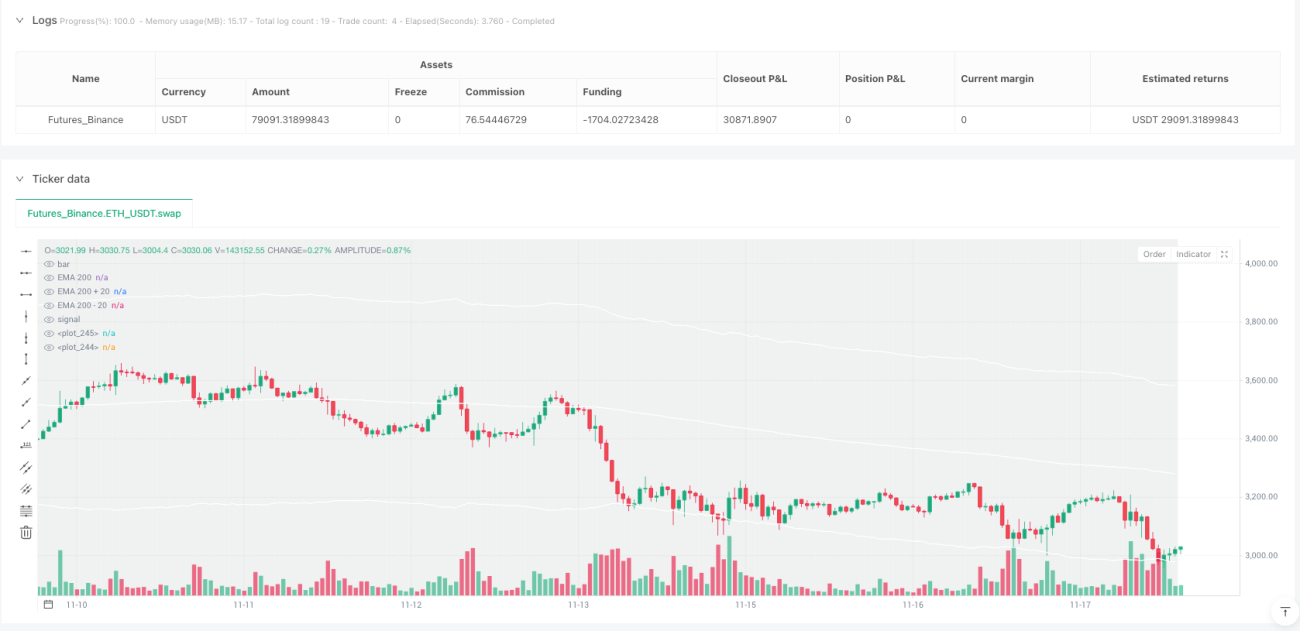
/*backtest
start: 2024-11-20 00:00:00
end: 2025-11-18 08:00:00
period: 1h
basePeriod: 1h
exchanges: [{"eid":"Futures_Binance","currency":"ETH_USDT"}]
*/

//@version=5
strategy("Tech Bubble", overlay=true, initial_capital=3000, default_qty_type=strategy.percent_of_equity,pyramiding = 1,  default_qty_value=100)

//Latch these variable- 1