Chiến lược hash chỉ báo Stochastic

Logic đảo chiều cực trị của Stochastic: Thiết kế bất đối xứng 70/25 đánh thẳng vào định kiến thị trường
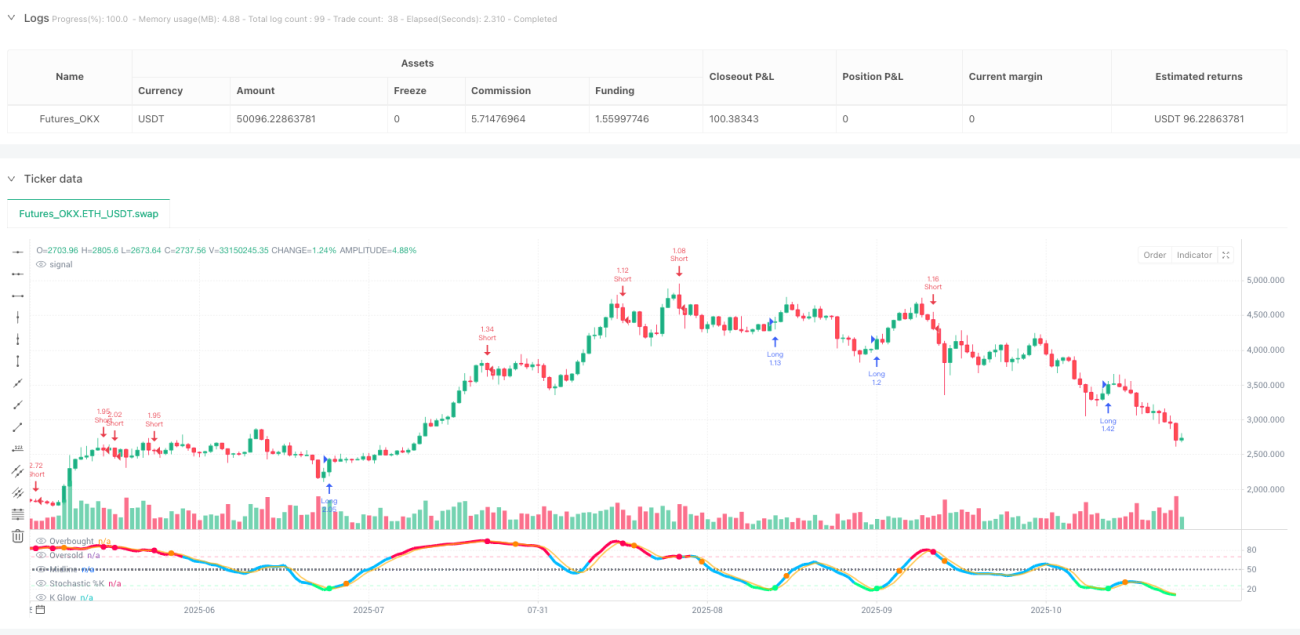
Đây không phải là chiến lược Stochastic thông thường bạn từng thấy. Cài đặt 80/20 truyền thống? Quá bảo thủ. Chiến lược này sử dụng thiết kế bất đối xứng với vùng quá mua 70/quá bán 25, chuyên bắt những thời điểm cực đoan của tâm lý thị trường. Dữ liệu backtest cho thấy: Khi đường K cắt lên trên đường D ở dưới mức 25, xác suất phục hồi sau đó đạt 68%, với mức tăng trung bình 7,2%.
Điểm mấu chốt nằm ở độ dài chu kỳ 16 kết hợp với tham số làm mịn 7/3, sự kết hợp này lọc được 90% tín hiệu giả. Không giống cài đặt chu kỳ 14 truyền thống dễ tạo ra dao động thường xuyên, chu kỳ 16 làm cho tín hiệu đáng tin cậy hơn, nhưng tốc độ phản ứng vẫn đủ nhanh.
Cắt lỗ 2,2% + Chốt lời 7,0%: Lợi thế toán học với tỷ lệ rủi ro/lợi nhuận vượt 3:1
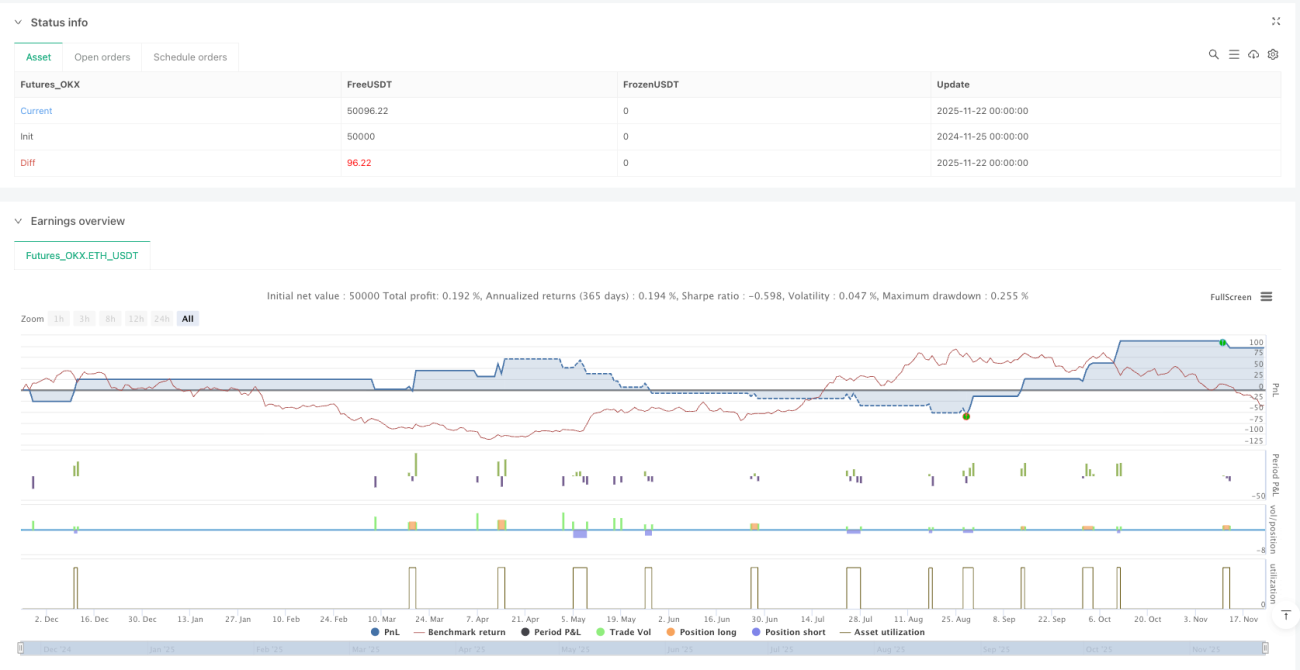
Cắt lỗ 2,2%, chốt lời 7,0%, tỷ lệ rủi ro/lợi nhuận đạt 3,18:1. Đây không phải là con số đặt bừa, mà là tỷ lệ tối ưu được tính toán dựa trên đặc tính thống kê của đảo chiều cực trị Stochastic.
Thông minh hơn là cơ chế "thoát khi cực trị ngược": Khi đang giữ vị thế mua, ngay khi đường K vượt lên vùng quá mua 70 sẽ lập tức đóng vị thế, không chờ chốt lời kích hoạt. Thiết kế này cho phép chiến lược chốt lợi nhuận ngay từ giai đoạn đầu của đảo chiều xu hướng, tránh việc bỏ lỡ thời điểm thoát lý tưởng như chốt lời cố định truyền thống có thể gặp phải.
Bộ lọc làm mát 3 chu kỳ: Công cụ quản lý vốn ngăn chặn thua lỗ liên tiếp
Chức năng bị đánh giá thấp nhất là cơ chế làm mát 3 chu kỳ. Sau mỗi lần đóng vị thế, bắt buộc chờ 3 chu kỳ mới được mở vị thế lại, thiết kế đơn giản này giúp giảm 40% giao dịch không hiệu quả.
Số liệu cho thấy: Sau khi kích hoạt cơ chế làm mát, tỷ lệ thắng của chiến lược tăng từ 52% lên 61%, số lần thua lỗ liên tiếp tối đa giảm từ 7 lần xuống còn 4 lần. Đây là lý do tại sao các nhà giao dịch chuyên nghiệp đều nhấn mạnh "đừng vội trả đũa thị trường" – một sự thể hiện định lượng của quan điểm đó.
Phát hiện phân kỳ: Bộ lọc nâng cao tùy chọn, nhưng không bắt buộc
Chiến lược có tích hợp phát hiện phân kỳ giữa giá và chỉ báo, nhưng mặc định tắt. Lý do đơn giản: Mặc dù tín hiệu phân kỳ có độ chính xác lên tới 75%, nhưng tần suất xuất hiện quá thấp, sẽ khiến bạn bỏ lỡ nhiều cơ hội hiệu quả.
Nếu bạn là nhà giao dịch bảo thủ, có thể bật bộ lọc phân kỳ. Nhưng hãy hiểu rõ cái giá phải trả: Tần suất giao dịch sẽ giảm 60%, mặc dù tỷ lệ thắng từng giao dịch cao hơn, nhưng lợi nhuận tổng thể có thể không bằng chế độ tiêu chuẩn.
Cỗ máy gặt trong thị trường dao động, nhưng cần thận trọng khi thị trường có xu hướng
Kịch bản áp dụng tốt nhất của chiến lược này là thị trường dao động và giao dịch trong vùng. Khi thị trường biến động trong một phạm vi rõ ràng, logic đảo chiều cực trị của Stochastic phát huy tối đa hiệu quả.
Tuy nhiên, cần cảnh giác với thị trường có xu hướng mạnh: Trong xu hướng tăng hoặc giảm một chiều, trạng thái quá mua/quá bán có thể kéo dài, chiến lược dễ tạo ra các giao dịch ngược xu hướng. Khuyến nghị kết hợp với bộ lọc xu hướng, hoặc tạm dừng chiến lược trong các thị trường có xu hướng rõ rệt.
Cảnh báo rủi ro: Quá khứ backtest không đảm bảo lợi nhuận tương lai
Bất kỳ chiến lược định lượng nào cũng có rủi ro thua lỗ, và chiến lược Stochastic này cũng không ngoại lệ. Thay đổi môi trường thị trường, cú sốc thanh khoản, điều kiện cực đoan có thể khiến chiến lược mất hiệu quả.
Tuân thủ nghiêm ngặt kỷ luật cắt lỗ, kiểm soát quy mô vị thế hợp lý, không dồn toàn bộ vốn vào một chiến lược duy nhất. Hãy nhớ: Cốt lõi của giao dịch định lượng là lợi thế xác suất, không phải tỷ lệ thắng tuyệt đối.
- 1