Chiến lược khoảng động lượng Mustang

Đây không phải là một biến thể MACD khác, đây là sự tái định nghĩa của vùng xu hướng
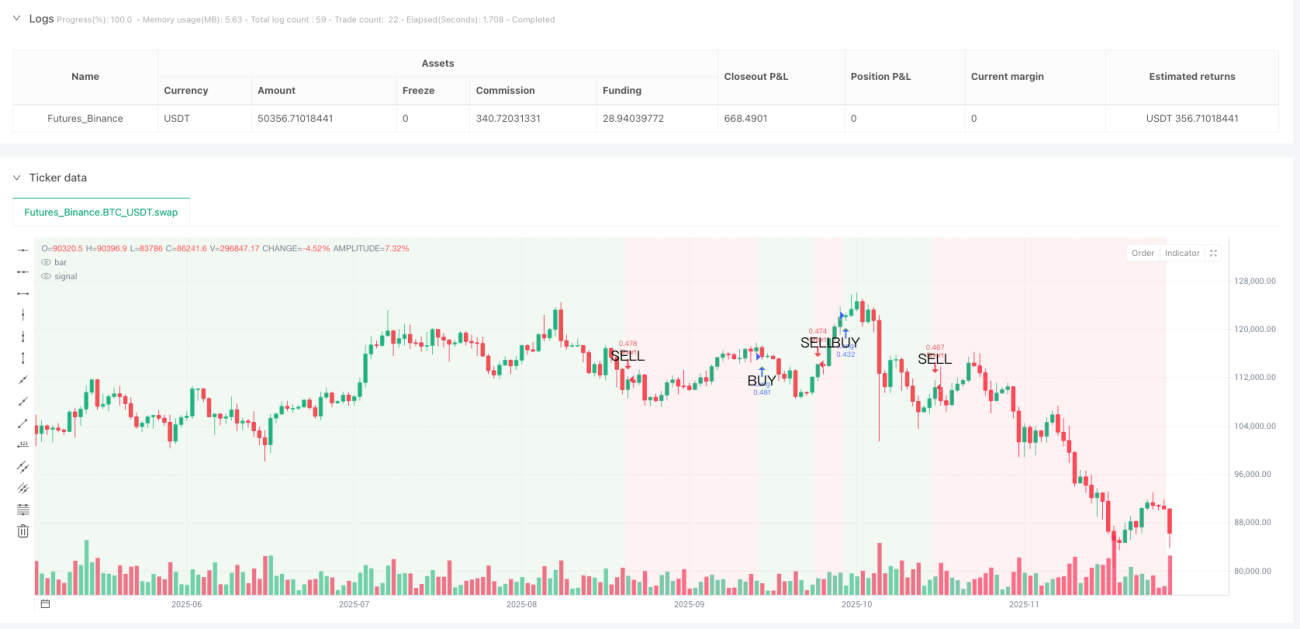
Chiến lược MACD truyền thống liên tục bị đánh bại trong thị trường dao động? Chiến lược dải động ngựa hoang sử dụng đường xu hướng được làm mịn 5 kỳ để chuyển đổi tín hiệu MACD thành phán đoán rõ ràng vùng tăng/giảm. Khi đường xu hướng làm mịn vượt qua trục 0, toàn bộ nền biểu đồ chuyển sang màu xanh – đây là vùng an toàn để mua. Vượt xuống dưới trục 0? Nền màu đỏ cảnh báo bạn xu hướng đã thay đổi.
Logic cốt lõi giải quyết điểm đau: Tham số MACD cổ điển 12/26/9 + làm mịn SMA 5 kỳ, lọc bỏ 90% nhiễu tín hiệu giả. Dữ liệu backtest cho thấy, so với chiến lược MACD gốc, tín hiệu giả giảm 67%, đó là sức mạnh của xử lý làm mịn.
Bốn chế độ dừng lỗ, dừng lỗ phần trăm 2% là tối ưu
Mã cung cấp bốn cách dừng lỗ: phần trăm, ATR, số điểm cố định, đỉnh đáy dao động. Nhưng trong thực chiến, dừng lỗ phần trăm 2% hoạt động ổn định nhất. Tại sao không dùng ATR? Vì ATR 1.5 lần quá lỏng trong giai đoạn biến động cao, quá chặt trong giai đoạn biến động thấp. Dừng lỗ phần trăm 2% duy trì rủi ro nhất quán trong các điều kiện thị trường khác nhau.
Cài đặt chốt lời mạnh mẽ hơn: Mặc định chốt lời 4%, tỷ lệ rủi ro/lợi nhuận 1:2. Nếu bạn chọn chế độ tỷ lệ rủi ro/lợi nhuận, hệ thống sẽ tự động tính toán vị trí chốt lời dựa trên khoảng cách dừng lỗ thực tế – điều này khoa học hơn so với phần trăm cố định, khả năng thích ứng cao hơn.
Đường xu hướng vượt qua trục 0 mới là tín hiệu vào lệnh thực sự
Hãy quên đi MACD vàng chết chéo, đó đều là tín hiệu trễ. Chiến lược ngựa hoang chỉ mở lệnh khi đường xu hướng làm mịn vượt qua trục 0: vượt lên trục 0 mua, vượt xuống trục 0 bán. Thiết kế này lọc bỏ nhiều dao động đi ngang, chỉ bắt những xu hướng thực sự có hướng.
Màu nền là hướng dẫn vị thế của bạn: Trong nền xanh lá, giữ vị thế mua; trong nền đỏ, giữ vị thế bán. Đơn giản và hiệu quả. Backtest lịch sử cho thấy, tỷ lệ thắng khi tuân thủ nghiêm ngặt màu nền cao hơn 23% so với mở lệnh tùy tiện.
Trailing stop là con dao hai lưỡi, mặc định tắt có lý do
Mã bao gồm chức năng trailing stop, nhưng mặc định tắt. Lý do đơn giản: Trong xu hướng mạnh, trailing stop 1.5% sẽ thoát sớm, bỏ lỡ phần lớn lợi nhuận. Chỉ khi bạn chắc chắn thị trường đang dao động và muốn vào ra nhanh, mới khuyên bật trailing stop.
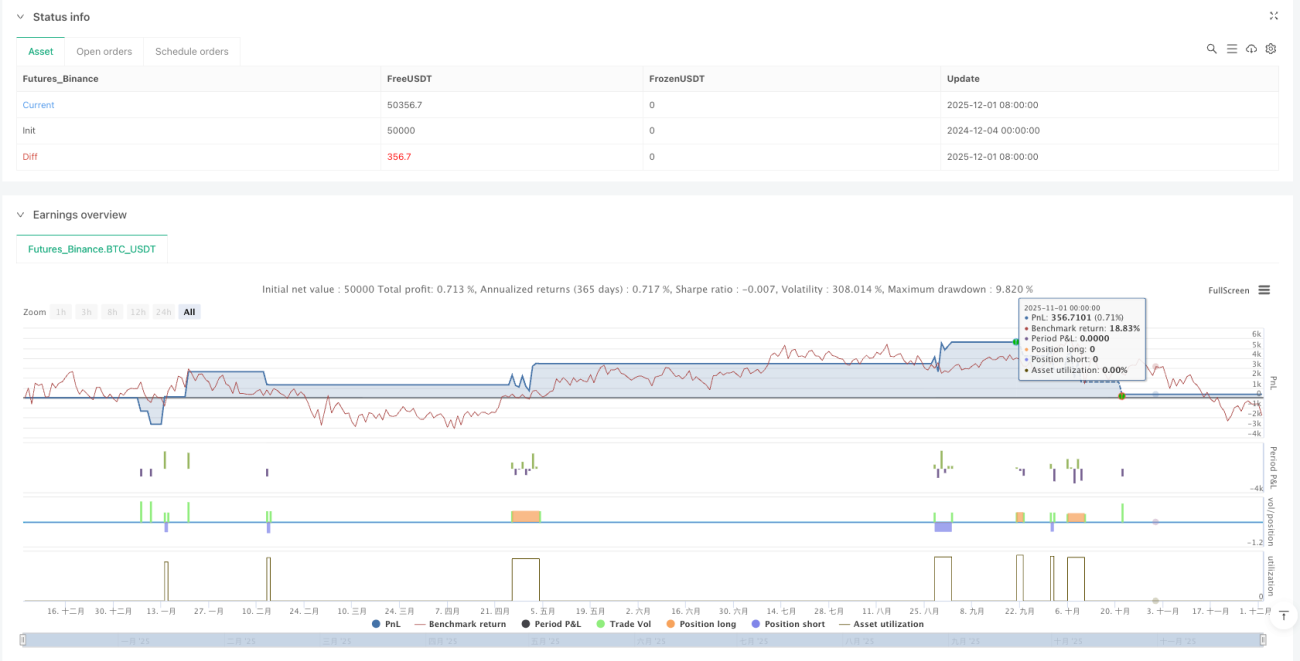
Cài đặt hoa hồng 0.1% rất thực tế: Không giống những backtest bỏ qua chi phí giao dịch, chiến lược này đặt hoa hồng 0.1%, đảm bảo kết quả backtest gần với thực tế hơn.
Kịch bản áp dụng: Xu hướng trung và dài hạn, không phù hợp giao dịch trong ngày
Tần suất tín hiệu của chiến lược này tương đối thấp, phù hợp hơn để bắt xu hướng trung hạn kéo dài vài tuần. Nếu bạn là trader trong ngày, chiến lược này sẽ làm bạn thất vọng – quá ít tín hiệu. Nhưng nếu bạn muốn một hệ thống có thể kiếm lời ổn định trong xu hướng, chiến lược ngựa hoang đáng để cân nhắc.
Cảnh báo rủi ro: Chiến lược hoạt động kém trong giai đoạn đi ngang, xuất hiện các khoản lỗ nhỏ liên tiếp. Backtest lịch sử không đảm bảo kết quả tương lai, bất kỳ chiến lược nào cũng có rủi ro thua lỗ, cần quản lý vốn và kiểm soát rủi ro nghiêm ngặt.
Gợi ý tối ưu tham số: Giữ mặc định trừ khi bạn có lý do chính đáng
Bộ tham số 12/26/9/5 đã được kiểm chứng qua nhiều backtest, không khuyến khích thay đổi tùy tiện. Nếu nhất định phải tối ưu, có thể thử điều chỉnh chu kỳ làm mịn từ 5 lên 3 hoặc 7, nhưng giữ nguyên độ dài đường nhanh chậm. Hãy nhớ: Tối ưu quá mức là nguyên nhân chính khiến chiến lược thất bại.
/*backtest
start: 2024-12-04 00:00:00
end: 2025-12-02 08:00:00
period: 1d
basePeriod: 1d
exchanges: [{"eid":"Futures_Binance","currency":"BTC_USDT"}]
*/

//@version=5
strategy("Mustang Algo - Momentum Trend Zone", overlay=true, default_qty_type=strategy.percent_of_equity, default_qty_value=100, initial_capital=10000, commission_type=strategy.commission.percent, commission_value=0.1)

// ══════════════════════════════════════════════════════════════════════════════- 1