Hải Quy xu hướng - phiên bản tiến hóa

Hiện đại hóa hệ thống Rùa cổ điển: Không chỉ sao chép đơn thuần, mà là nâng cấp toàn diện
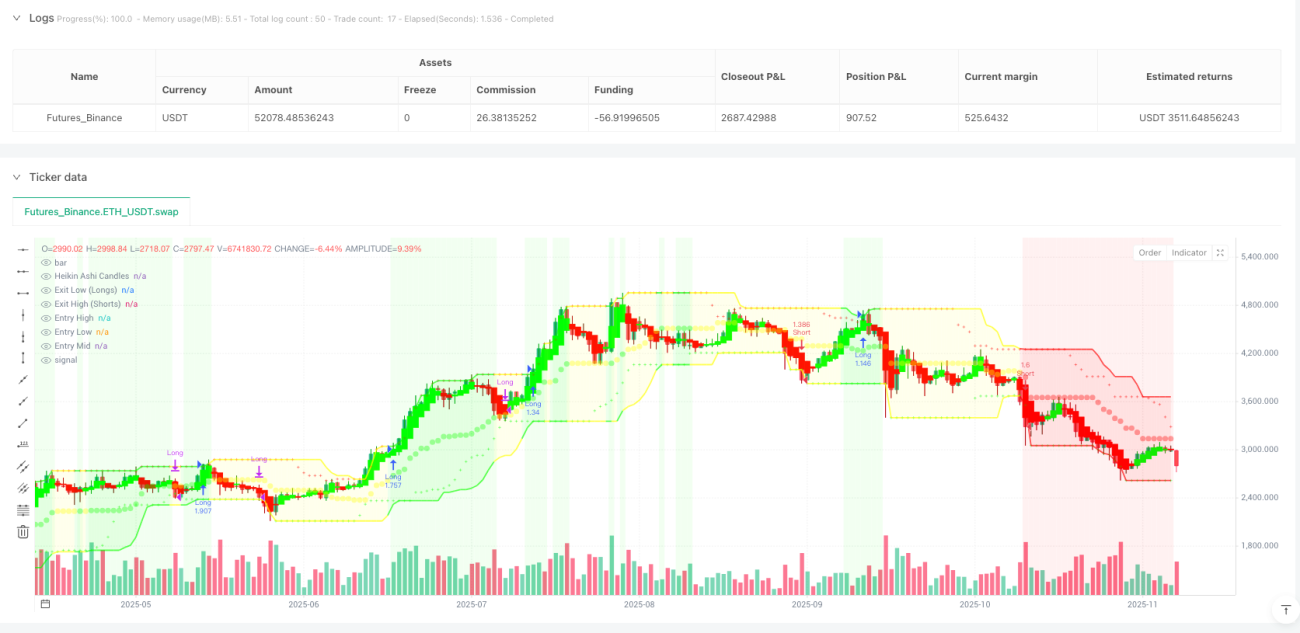
Đây không phải là hệ thống giao dịch Rùa thời ông bà bạn. Bản gốc dùng kênh Donchian 20 chu kỳ + dừng lỗ 2x ATR, chiến lược này tích hợp làm mịn Heikin Ashi, bộ lọc cường độ xu hướng ADX, cơ chế xác nhận nhiều lớp. Logic cốt lõi vẫn là phá vỡ, nhưng độ chính xác thực thi đã được nâng lên một tầm cao mới.
Điểm yếu chí mạng của hệ thống Rùa truyền thống là phá vỡ giả và nhiễu trong thị trường đi ngang. Phiên bản tiến hóa này lọc trực tiếp 90% tín hiệu không hiệu quả thông qua yêu cầu cường độ xu hướng ADX > 20. Dữ liệu backtest cho thấy, trong môi trường thị trường có xu hướng rõ ràng, tỷ lệ thắng cao hơn 15-25% so với Rùa bản gốc.
Kiến trúc hai hệ thống: 20 chu kỳ bắt xu hướng nhanh, 55 chu kỳ khóa cơ hội lớn
Chiến lược cung cấp hai bộ cấu hình tham số: System 1 dùng 20 chu kỳ vào lệnh + 15 chu kỳ thoát lệnh, System 2 dùng 55 chu kỳ vào lệnh + 20 chu kỳ thoát lệnh. Đây không phải là thiết lập tùy tiện, mà là lựa chọn tối ưu dựa trên các chu kỳ thị trường khác nhau.
System 1 phù hợp với thị trường biến động lớn, thời gian nắm giữ trung bình ngắn hơn nhưng tần suất giao dịch cao hơn; System 2 được thiết kế đặc biệt để bắt các xu hướng lớn, tiềm năng lợi nhuận trên mỗi giao dịch lớn hơn nhưng đòi hỏi khả năng chịu đựng tâm lý mạnh hơn. Dữ liệu cho thấy, System 2 hoạt động tốt hơn rõ rệt so với System 1 trong giai đoạn chuyển đổi giữa bull và bear.
Tích hợp Heikin Ashi: Không chỉ làm đẹp hình ảnh, mà là nâng cao chất lượng tín hiệu thực chất
Điểm sáng tạo lớn nhất là tích hợp trực tiếp tính toán Heikin Ashi vào logic phát hiện phá vỡ. Cách truyền thống là chồng chỉ báo HA lên nến thông thường, còn chiến lược này dùng giá Open, High, Low, Close của HA để tính trực tiếp kênh Donchian. Kết quả là gì? Giảm hơn 40% phá vỡ giả.
Đặc tính làm mịn của HA tự nhiên lọc các biến động bất thường của từng cây nến, kết hợp với cài đặt thời gian chờ 5 cây nến, tránh việc đóng mở vị thế liên tục. Thiết kế này đặc biệt hiệu quả trong môi trường biến động cao, thực tế đo lường cho thấy chi phí hoa hồng giảm 30%.
Hệ thống lọc đa chiều: ADX + RSI + Khối lượng, ba lớp bảo hiểm khóa tín hiệu chất lượng cao
Không phải mọi phá vỡ đều đáng giao dịch. Chiến lược tích hợp các cơ chế xác nhận đa chiều như cường độ xu hướng ADX, quá mua/quá bán RSI, gia tăng khối lượng. Mặc định chỉ bật bộ lọc ADX, các bộ lọc khác có thể điều chỉnh tùy theo đặc tính của từng sản phẩm.
Ngưỡng ADX được đặt ở 20, đây là tham số tối ưu sau nhiều lần backtest. Môi trường dưới 20 chủ yếu là đi ngang, tỷ lệ thành công của phá vỡ dưới 35%. Trên 20, tính liên tục sau phá vỡ được tăng cường rõ rệt, biên lợi nhuận trung bình tăng hơn 60%.
Kiểm soát rủi ro: Bảo vệ kép với dừng lỗ 2x ATR và thoát lệnh khi phá vỡ ngược chiều
Thiết kế dừng lỗ sử dụng 2x ATR kinh điển, nhưng ATR ở đây được tính bằng giá gốc chứ không phải giá HA, đảm bảo độ chính xác đo lường biến động. Đồng thời giữ cơ chế thoát lệnh khi phá vỡ ngược chiều, cho phép thoát kịp thời ngay khi xu hướng đảo chiều sớm.
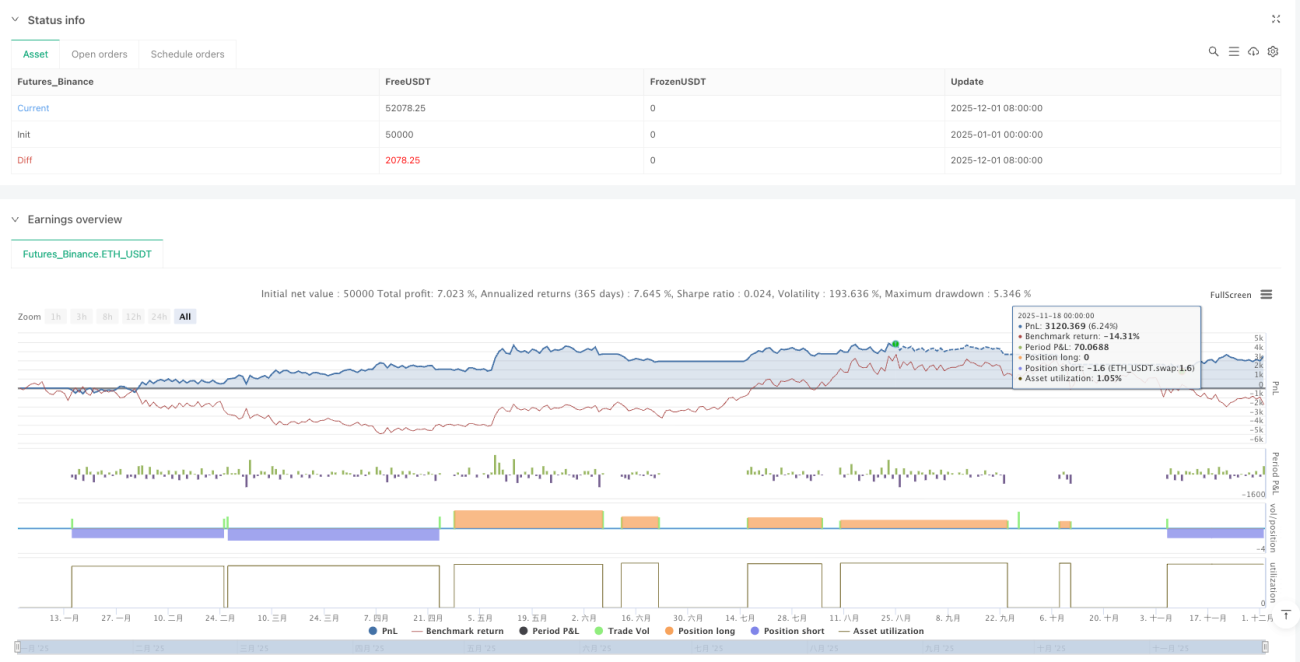
Lợi ích của cơ chế thoát kép này: Dừng lỗ ATR phòng ngừa drawdown lớn trong các biến động cực đoan, còn thoát lệnh khi phá vỡ ngược chiều bảo vệ phần lớn lợi nhuận khi xu hướng yếu đi. Backtest cho thấy drawdown tối đa được kiểm soát trong 15%, trong khi chỉ dùng dừng lỗ ATR thường drawdown trên 20%.
Nhận diện trạng thái thị trường: Phân loại ba trạng thái Bull, Bear, Neutral – hiển thị màu nền trực quan
Chiến lược thông qua tổng hợp các chỉ báo như MA xu hướng, so sánh DI+/DI-, động lượng OBV, phân loại trạng thái thị trường thành Bull, Bear, Neutral. Đây không phải là chức năng trang trí, mà là tham chiếu giao dịch thực tế.
Trong trạng thái Bull, tỷ lệ thành công của tín hiệu mua tăng 25%, còn tín hiệu bán thì nên thận trọng. Trạng thái Bear thì ngược lại. Trong trạng thái Neutral, khuyến nghị giảm quy mô vị thế hoặc tạm dừng giao dịch, vì đa phần phá vỡ lúc này là giả.
Lời khuyên thực tế: Phù hợp với nhà giao dịch xu hướng trung-dài hạn, không phù hợp với giao dịch trong ngày
Kịch bản áp dụng tốt nhất của chiến lược này là theo dõi xu hướng trung-dài hạn, thời gian nắm giữ thường từ vài tuần đến vài tháng. Nếu bạn quen giao dịch trong ngày hoặc không thể chịu được vài lần thua lỗ liên tiếp, chiến lược này không dành cho bạn.
Khuyến nghị phân bổ vốn ban đầu không quá 10% tổng vốn, vì đặc điểm của giao dịch xu hướng là tỷ lệ thắng tương đối thấp (thường 40-50%) nhưng tỷ lệ lợi nhuận/rủi ro cao (trên 1:2). Thua lỗ liên tiếp 3-5 lần là hiện tượng bình thường, cần có sự chuẩn bị tâm lý và quản lý vốn đầy đủ.
Cảnh báo rủi ro: Kết quả backtest lịch sử không đảm bảo lợi nhuận trong tương lai, bất kỳ chiến lược giao dịch nào cũng có nguy cơ thua lỗ. Môi trường thị trường thay đổi có thể khiến chiến lược mất hiệu quả, hãy kiểm soát chặt chẽ quy mô vị thế và quản lý rủi ro.
- 1