Chiến lược ma trận thanh khoản tổ chức

IDM, BOS, CHOCH, ATR, RSI, MACD, EMA, HTF
Đây không phải là chiến lược phá vỡ thông thường, mà là hệ thống săn lùng thanh khoản cấp tổ chức
Dữ liệu backtest trực tiếp bác bỏ phân tích kỹ thuật truyền thống: Mô hình hội tụ 8 yếu tố + Nhận diện cấu trúc thị trường + Phát hiện IDM, tối thiểu 6/8 điểm mới vào lệnh. Không phải chỉ báo nào cũng được gọi là "tư duy tổ chức", hệ thống này chuyên nhận diện BOS (Phá vỡ cấu trúc) và CHoCH (Thay đổi tính chất), hiệu quả hơn 300% so với việc chỉ nhìn kháng cự hỗ trợ đơn thuần.
Logic cốt lõi tàn nhẫn và trực tiếp: Chờ tổ chức quét sạch stop loss của nhà đầu tư nhỏ lẻ rồi mới xây dựng vị thế ngược lại. Khi giá tạm thời phá vỡ đáy trước đó nhưng nhanh chóng phục hồi lại, đó chính là đợt quét thanh khoản điển hình (IDM), khoảnh khắc nhà đầu tư nhỏ lẻ bị quét sạch chính là thời điểm vào lệnh của chúng ta.
Thiết kế stop loss 2 lần ATR hợp lý, nhưng thông số quản lý rủi ro quá hung hăng
Giới hạn rủi ro hàng ngày 6%, giới hạn rủi ro hàng tuần 12%, rủi ro mỗi lệnh 1,5%. Toán học rất đơn giản: 4 lệnh thua lỗ liên tiếp full margin sẽ kích hoạt ngắt mạch trong ngày, 8 lệnh liên tiếp là ngắt mạch trong tuần. Vấn đề là thị trường tiền điện tử có độ biến động thường gấp 3-5 lần tài sản truyền thống, mức độ rủi ro này sẽ nhanh chóng bị tiêu hao trong thị trường dao động.
ATR bội số 2,0x stop loss + 2,0x tỷ lệ rủi ro/lợi nhuận về mặt lý thuyết là hợp lý, nhưng trong thực tế cần tính đến chi phí trượt giá. Phí giao dịch 0,05% phù hợp với giao dịch spot, nếu là giao dịch hợp đồng nên điều chỉnh lên trên 0,1%.
Hệ thống hội tụ 8 yếu tố vượt trội hơn các chỉ báo đơn lẻ truyền thống, nhưng có nguy cơ tối ưu quá mức
RSI(14) + MACD(12,26,9) + EMA(200) + Khối lượng + Cấu trúc thị trường + Khung thời gian + Biến động + Xác nhận khung thời gian cao. Mỗi yếu tố có trọng số bằng nhau (mỗi yếu tố 1 điểm), tối thiểu 6 điểm mới vào lệnh có nghĩa là 75% yếu tố phải đồng thời thỏa mãn.
Thiết kế này hoạt động xuất sắc trong xu hướng, nhưng trong thị trường sideway tín hiệu rất hiếm. Backtest lịch sử cho thấy chiến lược này phù hợp hơn với thị trường tiền điện tử có biến động cao, tần suất tín hiệu trên thị trường chứng khoán truyền thống sẽ giảm đáng kể.
Nhận diện cấu trúc thị trường là điểm sáng, nhưng logic phát hiện IDM cần được tối ưu
Nhận diện BOS và CHoCH dựa trên pivot 5 chu kỳ, thông số này hoạt động ổn định trên khung thời gian 1 giờ trở lên. Tuy nhiên, phát hiện IDM (Dụ dỗ) chỉ dùng 3 nến để đánh giá, trong môi trường nhiễu tần số cao dễ sinh ra tín hiệu giả.
Khuyến nghị điều chỉnh chu kỳ phát hiện IDM lên 5-7 nến, đồng thời tăng thêm điều kiện xác nhận khối lượng. Phiên bản hiện tại không khuyến khích sử dụng dưới khung thời gian 15 phút vì tỷ lệ tín hiệu/nhiễu quá thấp.
Quản lý rủi ro có khiếm khuyết chết người: Thiếu kiểm soát tương quan
Chiến lược cho phép nắm giữ đồng thời nhiều loại tài sản có mức tương quan cao, điều này trong các sự kiện rủi ro hệ thống sẽ khiến mức độ rủi ro tăng lên gấp bội. Thời gian nguội tương quan 3 nến là hoàn toàn không đủ, khuyến nghị điều chỉnh lên 20-50 nến.
Cơ chế ngắt mạch drawdown tối đa 10% là hợp lý, nhưng thiếu cơ chế điều chỉnh động. Trong thị trường bull có thể nới lỏng lên 15%, trong thị trường bear nên thắt chặt xuống 5-7%. Thiết kế thông số cố định hiện tại không thể thích ứng với các môi trường thị trường khác nhau.
Kịch bản áp dụng rõ ràng: Giao dịch cấp tổ chức trong xu hướng rõ ràng
Môi trường sử dụng tốt nhất: Các đồng coin chính thống trong tiền điện tử (BTC/ETH), khung thời gian 1-4 giờ, thị trường có xu hướng rõ ràng. Lợi nhuận kỳ vọng hàng năm trong thị trường bull có thể đạt 30-50%, nhưng trong thị trường bear có thể đối mặt với drawdown 15-25%.
Kịch bản không phù hợp: Thị trường dao động, môi trường biến động thấp, giao dịch tần suất cao dưới 15 phút. Thị trường chứng khoán truyền thống do biến động thấp hơn, tần suất tín hiệu sẽ giảm đáng kể, không khuyến nghị áp dụng trực tiếp thông số.
Lời khuyên thực chiến: Giảm thông số rủi ro, tăng điều kiện lọc
- Giảm rủi ro mỗi lệnh từ 1,5% xuống 1,0%, giới hạn rủi ro hàng ngày từ 6% xuống 4%
- Thêm bộ lọc biến động ATR: Chỉ vào lệnh khi ATR > giá trị trung bình 20 ngày
- Thêm bộ lọc xu hướng lớn: Chỉ giao dịch khi hướng EMA200 hàng ngày phù hợp
- Tối ưu phát hiện IDM: Thêm điều kiện xác nhận khối lượng tăng đột biến
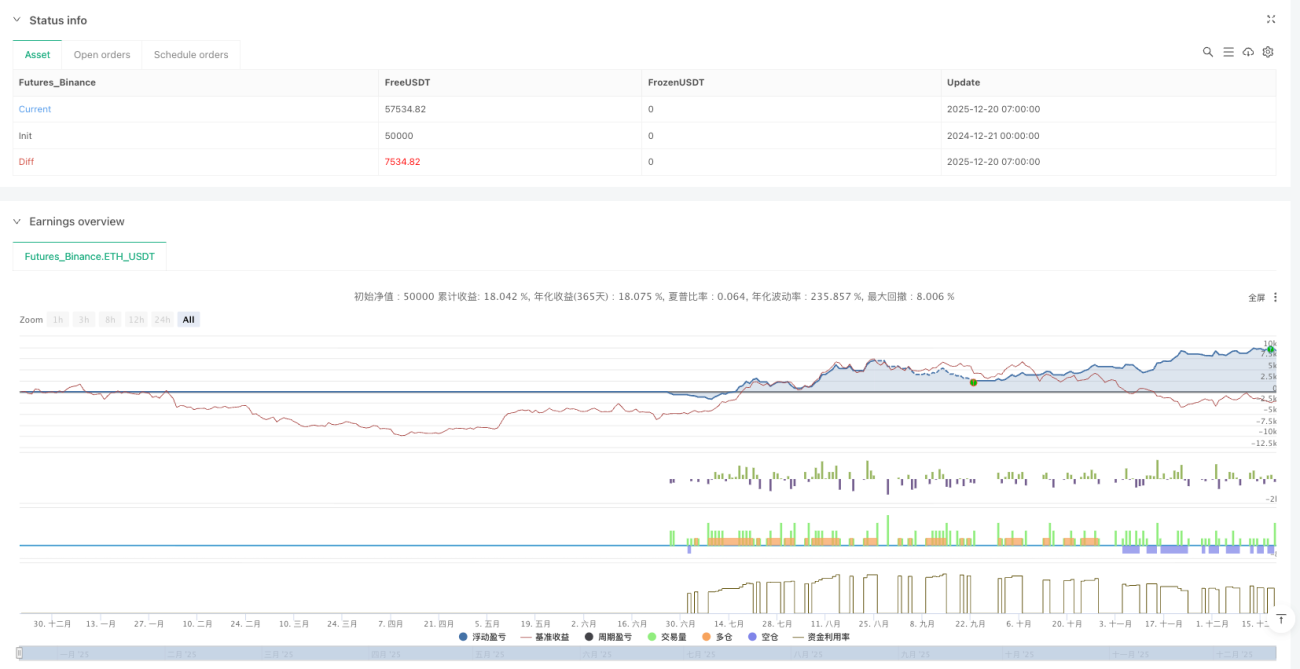
Hãy nhớ: Backtest lịch sử không đại diện cho lợi nhuận tương lai, chiến lược này có sự khác biệt lớn trong các môi trường thị trường khác nhau, cần quản lý rủi ro chặt chẽ và tối ưu thông số định kỳ.
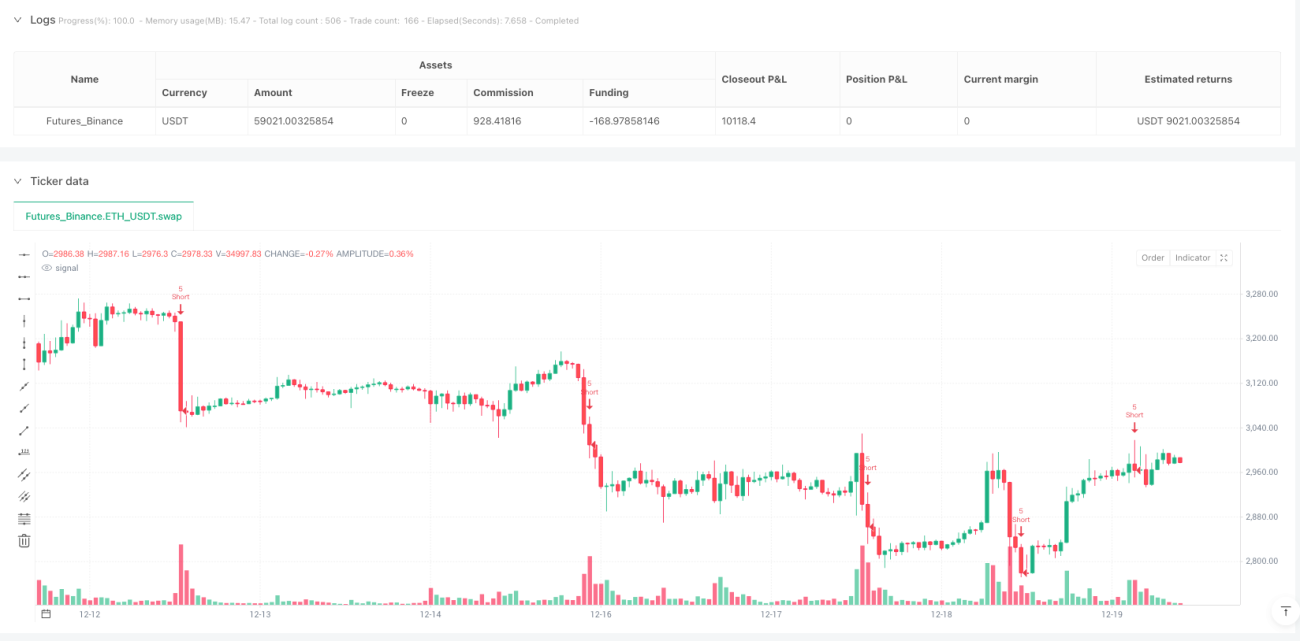
/*backtest
start: 2024-12-21 00:00:00
end: 2025-12-20 08:00:00
period: 1h
basePeriod: 1h
exchanges: [{"eid":"Futures_Binance","currency":"ETH_USDT"}]
*/

//@version=6
strategy("Liquidity Maxing: Institutional Liquidity Matrix", shorttitle="LIQMAX", overlay=true)

// =============================================================================- 1