Chiến lược Scalping Gamma Black-Scholes: Trí tuệ định lượng của nhà tạo lập thị trường quyền chọn

BS, GAMMA, DELTA, THETA, VEGA
Tại sao các nhà tạo lập thị trường quyền chọn luôn kiếm lợi nhuận từ biến động?
Trong thế giới giao dịch định lượng, có một hiện tượng có vẻ mâu thuẫn: Khi nhà đầu tư cá nhân lo lắng vì biến động thị trường, các nhà tạo lập thị trường quyền chọn lại có thể kiếm lợi nhuận ổn định. Bí mật đằng sau điều này là gì? Câu trả lời nằm ở chiến lược gamma scalping dựa trên mô hình Black-Scholes mà hôm nay chúng ta sẽ phân tích.
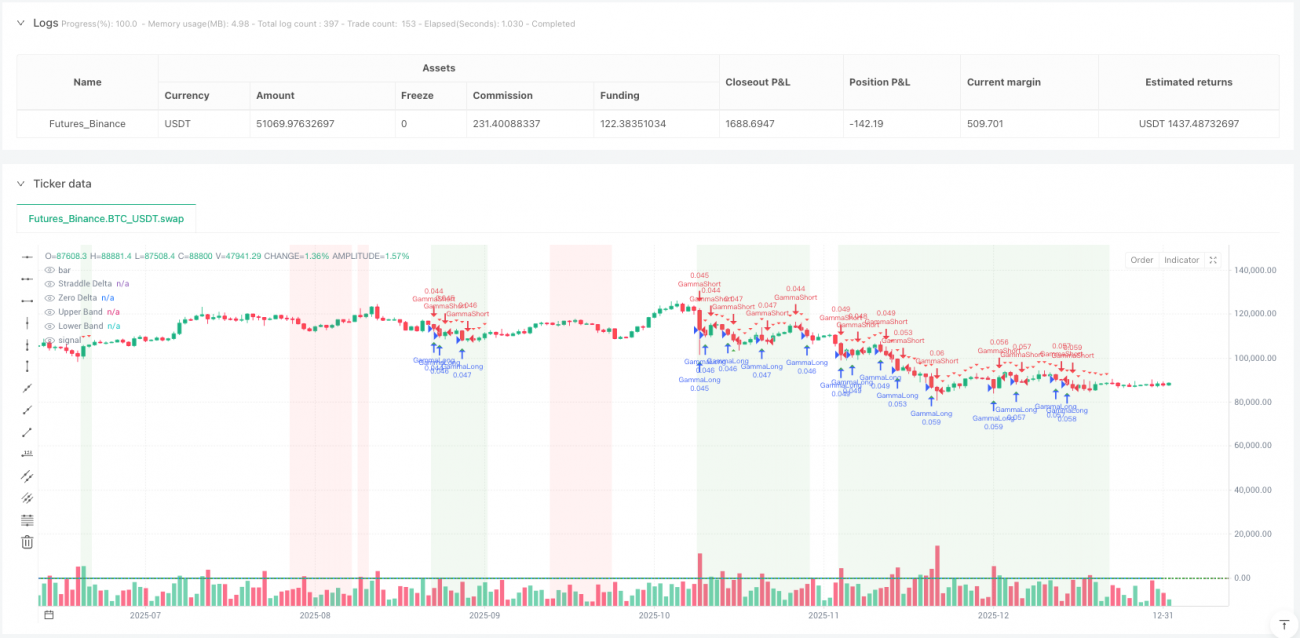
Ý tưởng cốt lõi của chiến lược này là mô phỏng hành vi giao dịch của nhà tạo lập thị trường quyền chọn: Thông qua việc xây dựng hợp đồng quyền chọn straddle tổng hợp (long straddle), sử dụng hiệu ứng gamma để phòng ngừa rủi ro động, từ đó thu lợi nhuận từ chênh lệch biến động. Nói một cách đơn giản, đó là để toán học làm việc cho chúng ta, thay vì đấu tranh với tâm lý thị trường.
Cơ sở toán học của chiến lược: Ứng dụng thực tế của mô hình Black-Scholes
Mô hình Black-Scholes không chỉ là lý thuyết hàn lâm, nó là nền tảng của định giá quyền chọn hiện đại. Trong chiến lược này, chúng ta tập trung vào năm chữ cái Hy Lạp:
Delta (Δ): Đo lường độ nhạy của giá quyền chọn đối với sự thay đổi giá tài sản cơ sở. Đối với hợp đồng straddle, sự thay đổi delta cung cấp tín hiệu phòng ngừa.
Gamma (Γ): Tốc độ thay đổi của delta, đây là cốt lõi của chiến lược. Gamma dương có nghĩa là khi giá tăng, delta tăng; khi giá giảm, delta giảm, tạo ra cơ hội "mua thấp bán cao".
Theta (Θ): Suy giảm theo thời gian, đây là chi phí chúng ta cần vượt qua. Chỉ khi biến động thực tế vượt quá biến động ngụ ý, lợi nhuận từ giao dịch gamma mới có thể bù đắp cho sự suy giảm thời gian.
Vega (ν): Độ nhạy cảm với biến động, giúp chúng ta đánh giá môi trường biến động.
Từ góc nhìn triển khai mã, chiến lược sử dụng công thức Black-Scholes tiêu chuẩn để tính các chữ cái Hy Lạp này, và thông qua hàm phân phối chuẩn (sử dụng xấp xỉ Abramowitz & Stegun) để đảm bảo độ chính xác tính toán.
Làm thế nào để xác định thời điểm giao dịch tốt nhất?
Chiến lược thiết kế ba lớp cơ chế lọc tín hiệu:
Lớp thứ nhất: Nhận diện chế độ biến động
So sánh tỷ lệ giữa biến động lịch sử và biến động ngụ ý để đánh giá môi trường biến động hiện tại. Khi biến động lịch sử / biến động ngụ ý > 1.2, điều đó cho thấy biến động thực tế thị trường vượt quá kỳ vọng định giá quyền chọn, đây là môi trường lý tưởng để thực hiện gamma scalping.
Lớp thứ hai: Bộ kích hoạt gamma scalping
Khi giá di chuyển vượt quá bội số cụ thể của ATR, tín hiệu giao dịch được kích hoạt. Thiết kế này rất khéo léo: Nó đảm bảo chúng ta chỉ thực hiện giao dịch phòng ngừa khi có đủ biến động giá, tránh giao dịch quá mức.
Lớp thứ ba: Dải phòng ngừa delta
Khi delta ròng của hợp đồng straddle lệch khỏi vị trí trung tính vượt quá ngưỡng thiết lập, tín hiệu phòng ngừa được tạo ra. Điều này mô phỏng hành vi duy trì delta trung tính của nhà tạo lập thị trường.
Chiến lược này hiệu quả nhất trong trường hợp nào?
Từ phân tích logic chiến lược, các tình huống sử dụng tốt nhất bao gồm:
-
Môi trường biến động cao: Khi biến động thực tế thị trường liên tục cao hơn biến động ngụ ý, giao dịch gamma có thể tạo ra lợi nhuận vượt trội.
-
Điều chỉnh trong xu hướng mạnh: Các đợt điều chỉnh ngắn hạn trong xu hướng mạnh thường tạo ra cơ hội gamma scalping tốt.
-
Biến động do sự kiện: Sự thay đổi biến động xung quanh các sự kiện như báo cáo tài chính, quyết định ngân hàng trung ương, v.v., cung cấp môi trường giao dịch lý tưởng cho chiến lược.
Cần lưu ý rằng chiến lược có hiệu quả hạn chế trong thị trường đi ngang biến động thấp, vì biến động giá không đủ để kích hoạt tín hiệu giao dịch gamma hiệu quả.
Thiết kế tinh tế trong quản lý rủi ro
Quản lý rủi ro của chiến lược này thể hiện trình độ chuyên nghiệp của giao dịch định lượng:
Quản lý vị thế động: Điều chỉnh quy mô vị thế theo biến động, giảm vị thế khi biến động cao, tăng vị thế khi biến động thấp, trái ngược hoàn toàn với quản lý vị thế cố định truyền thống.
Cơ chế cắt lỗ đa lớp: Kết hợp cắt lỗ theo bội số ATR, bảo vệ drawdown tối đa và cơ chế thoát dựa trên giá trị thời gian.
Giới hạn vị thế đồng thời: Kiểm soát tổng rủi ro thông qua việc giới hạn số lượng vị thế tối đa cùng lúc.
Điểm sáng tạo và hạn chế của chiến lược
Điểm sáng tạo:
- Chuyển đổi hoàn chỉnh tính toán chữ cái Hy Lạp phức tạp của quyền chọn sang giao dịch cổ phiếu/hợp đồng tương lai
- Nhận diện chế độ biến động động, thay vì tham số tĩnh
- Cơ chế xác nhận tín hiệu đa chiều, giảm tín hiệu giả
Hạn chế tiềm ẩn:
- Nhạy cảm với chi phí giao dịch, cần môi trường phí thấp
- Trong điều kiện thị trường cực đoan, các giả định của mô hình Black-Scholes có thể không còn hiệu lực
- Chiến lược khá phức tạp, cần kiểm tra backtest đầy đủ
Lời khuyên thực tế và hướng tối ưu hóa
Dựa trên phân tích chuyên sâu về mã, tôi đề xuất:
- Tối ưu hóa tham số: Điều chỉnh động ngưỡng biến động và độ rộng dải phòng ngừa cho từng môi trường thị trường khác nhau
- Xác nhận khung thời gian đa dạng: Kết hợp xu hướng biến động của khung thời gian dài hơn để lọc tín hiệu
- Kiểm soát chi phí: Trong giao dịch thực tế, kiểm soát chặt chẽ trượt giá và phí giao dịch, điều này ảnh hưởng trực tiếp đến khả năng sinh lời của chiến lược
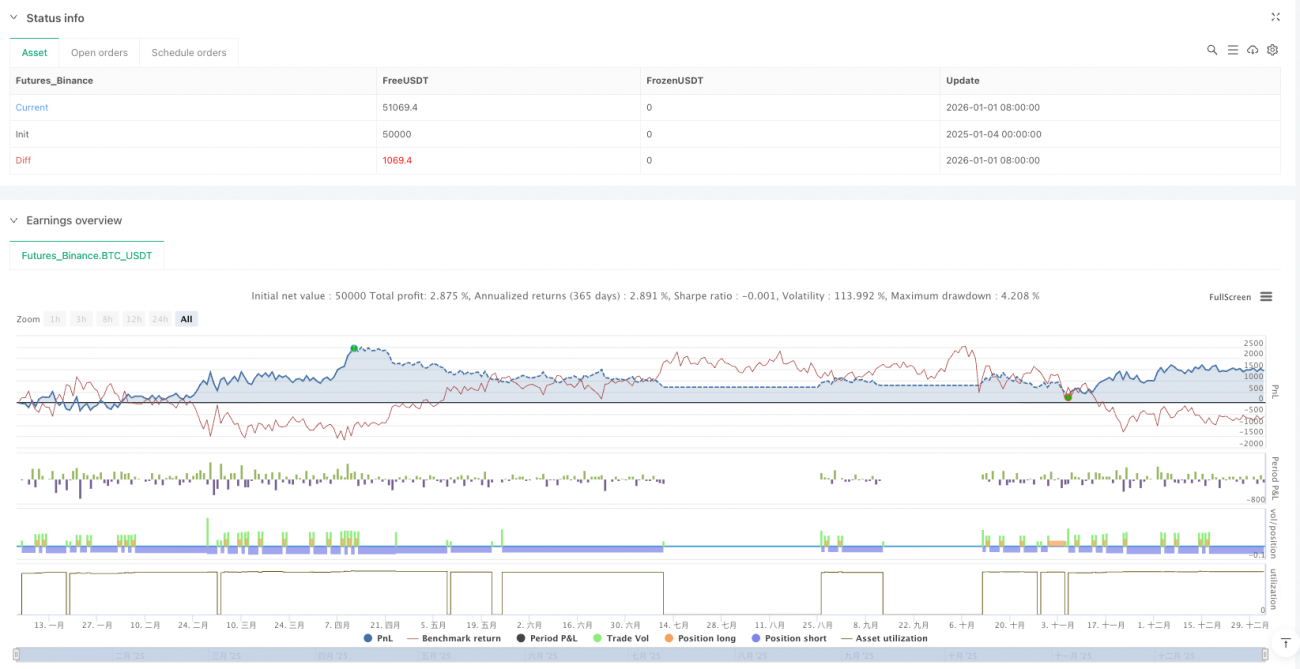
Chiến lược này thể hiện sức hấp dẫn của giao dịch định lượng: Thông qua mô hình toán học, đơn giản hóa hành vi thị trường phức tạp thành các quy tắc giao dịch có thể thực thi. Mặc dù nó không đảm bảo mỗi giao dịch đều có lợi nhuận, nhưng trong dài hạn, nó cung cấp cho chúng ta một khuôn khổ giao dịch có kỳ vọng dương.
Đối với những nhà giao dịch định lượng muốn hiểu sâu bản chất của giao dịch quyền chọn, chiến lược này chắc chắn là một ví dụ học tập xuất sắc. Nó không chỉ cho thấy cách chuyển đổi lý thuyết thành thực tiễn, mà quan trọng hơn, nó tiết lộ cách các nhà giao dịch chuyên nghiệp tư duy về thị trường: không phải dự đoán hướng đi, mà là quản lý rủi ro, để xác suất làm việc cho chúng ta.
- 1