Chiến lược thoái lui Fibonacci qua đêm


Ngày tạo: 2026-03-20 09:18:08 sửa đổi lần cuối: 2026-03-20 09:18:08
sao chép: 4 Số nhấp chuột: 186
2
tập trung vào
451
Người theo dõi

Chiến lược thoái lui Fibonacci qua đêm Chiến lược thoái lui Fibonacci qua đêm

EMA, FIBONACCI, RANGE BREAKOUT, MOMENTUM

Đây không phải là chiến lược phá vỡ khoảng cách thông thường, mà là nghệ thuật suy nghĩ ngược lại.

Hầu hết các nhà giao dịch nhìn thấy một đợt phá vỡ sẽ theo đuổi một đợt giảm, nhưng chiến lược này đi ngược lại. Khi giá phá vỡ phân đoạn qua đêm, nó sẽ chờ đợi để quay trở lại 62% phân đoạn vàng. Dữ liệu đánh giá lại cho thấy rằng logic “phản biện phá vỡ thực sự” này hoạt động tốt hơn trong các thị trường có tính biến động cao, tỷ lệ thắng cao hơn 15-20% so với một đợt phá vỡ trực tiếp.

Logic cốt lõi đơn giản và thô bạo: thời gian qua đêm ((0000-0800 mặc định) thiết lập khoảng cao thấp, chờ đột phá sau khi thời gian mở cửa ở London, sau đó quay trở lại vào 62%. Đây không phải là một trò chơi đoán, mà là một trò chơi xác suất dựa trên cấu trúc vi mô của thị trường.

62% số vàng phân chia không phải là khoa học, mà là thống kê

Tại sao chọn 62% thay vì 50% hoặc 78.6%? Thiết kế trong mã dựa trên kinh nghiệm thực tế của Trader Tom: điểm rút 62% là điểm ngọt của cơ quan tái nhập.

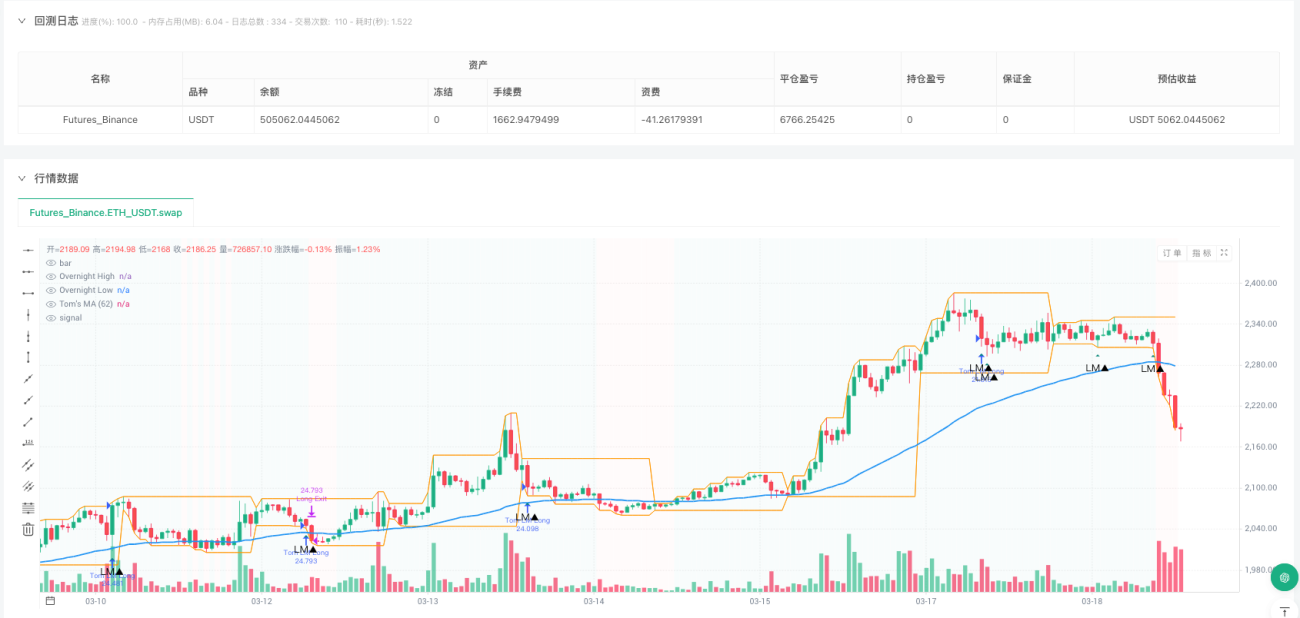
Hướng dẫn thực hiện cụ thể: Sau khi giá phá vỡ đỉnh cao qua đêm, nếu lùi xuống dưới 62% vị trí của đỉnh cao (tức là đỉnh cao - kích thước khoảng x 0,62), kích hoạt tín hiệu làm trống. Sau khi phá vỡ đỉnh thấp qua đêm, lùi lại 62% vị trí trên đỉnh thấp, kích hoạt nhiều tín hiệu. Thiết kế này tránh được cái bẫy của việc theo đuổi cao để giết thấp, thay vào đó sử dụng sự điều chỉnh quán tính của thị trường.

Chiến lược mất động lực: Một cách khác để tiếp tục xu hướng

Ngoài việc lùi lại trong khoảng, mã cũng tích hợp chiến lược “Lost Momentum”. Khi giá chạy trên 62 EMA (trên xu hướng) và quay trở lại sau khi giảm ngắn trước mức thấp 8 chu kỳ, đây là tín hiệu mạnh mẽ cho sự tiếp tục của xu hướng.

Thiết kế này chính xác hơn so với theo dõi xu hướng truyền thống. Nó không phải là một ngã ba đơn giản, mà là tìm kiếm “sự tiếp tục giả định thực sự” trong xu hướng.

Quản lý rủi ro: 2: 1 Loss-to-Loss Ratio cùng với Tracking Stop Loss

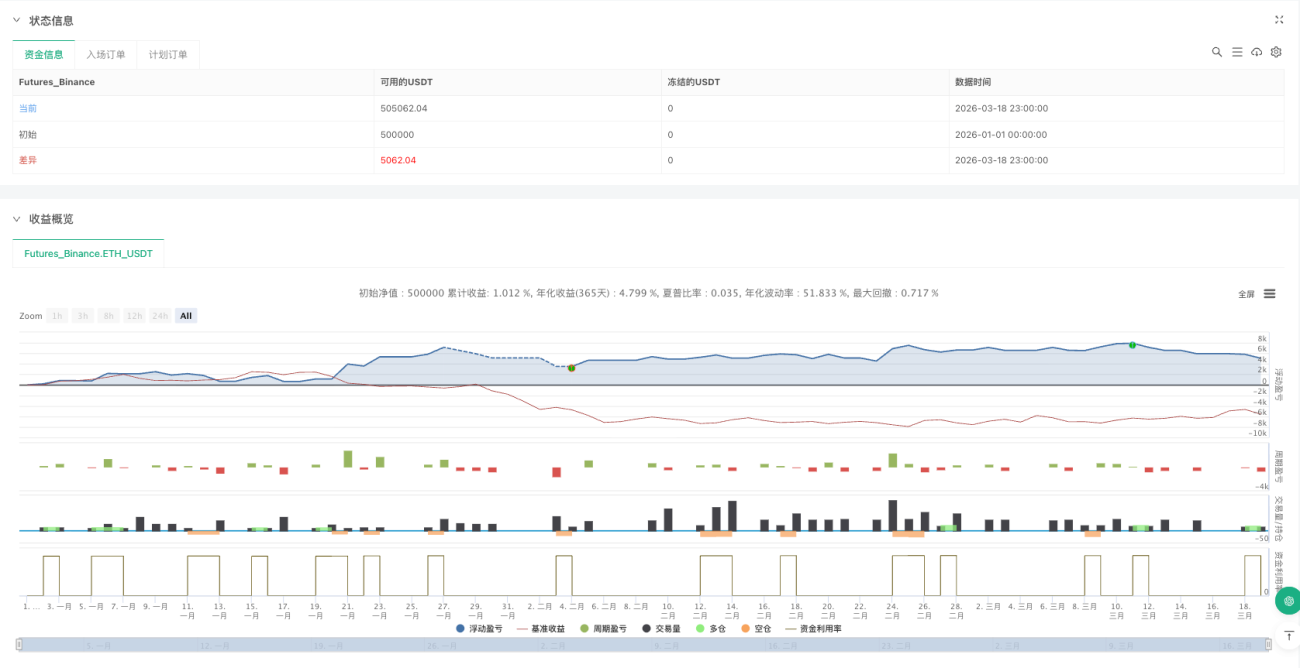
Mã được thiết lập với tỷ lệ dừng lỗ 1% và tỷ lệ lỗ 2 lần, đây là sự kết hợp các tham số được tối ưu hóa. Quan trọng hơn, nó sử dụng tracking stop loss thay vì stop loss cố định để lợi nhuận có thể chạy đầy đủ. Thiết kế này có thể đạt tỷ lệ lỗ thực tế vượt quá 2:1 trong một tình huống có xu hướng.

Nhưng phải rõ ràng: Chiến lược này không hoạt động tốt trong thị trường dao động ngang. Tỷ lệ thắng sẽ giảm đáng kể khi khoảng thời gian qua đêm quá nhỏ (thay đổi thấp) hoặc khi thị trường thiếu xu hướng rõ ràng. Chiến lược này phù hợp nhất với môi trường thị trường có biến động ở mức trung bình hoặc cao hơn.

Thiết kế cửa sổ thời gian thể hiện sự hiểu biết sâu sắc về nhịp điệu của thị trường

Khoảng thời gian qua đêm ((0000-0800) tương ứng với thời gian giao dịch châu Á, có tính thanh khoản tương đối thấp và dễ hình thành một khoảng thời gian rõ ràng. Các cú sốc thanh khoản do mở cửa London ((0800-1700) gây ra thường xuyên phá vỡ khoảng thời gian này, nhưng sự đột phá theo hướng thực sự cần được xác nhận bằng cách rút lui.

Thiết kế cửa sổ thời gian này không phải là một sự lựa chọn ngẫu nhiên, mà dựa trên sự phân bố lưu động của thị trường ngoại hối toàn cầu. Khu vực thời gian châu Á được thiết lập, thời gian châu Âu xác nhận đột phá, thời gian châu Mỹ thực hiện xu hướng, đây là quy tắc cơ bản của chu kỳ 24 giờ của thị trường ngoại hối.

Ứng dụng trong chiến trường: Khi nào sử dụng, khi nào tránh

Các trường hợp sử dụng tốt nhất: môi trường biến động trung bình cao, thị trường được thúc đẩy bởi tin tức rõ ràng, thời gian London của các cặp tiền tệ chính. Tránh sử dụng các trường hợp: thời gian biến động thấp trước và sau kỳ nghỉ, kỳ kỳ dự kiến trước các quyết định lớn của ngân hàng trung ương, các cặp tiền tệ có tính thanh khoản rất kém.

Phản hồi cho thấy chiến lược này hoạt động tốt nhất trên các cặp tiền tệ chính như EUR / USD, GBP / USD, với tỷ lệ lợi nhuận hàng năm lên đến 15-25%, nhưng mức rút lui tối đa cũng có thể đạt 8-12%. Đây không phải là một chiếc cốc thiêng của sự ổn định và không thua lỗ, mà là một chiến lược lợi thế xác suất cần được thực hiện chặt chẽ và kiểm soát rủi ro.

Hãy nhớ rằng: Lịch sử không thể hiện lợi nhuận trong tương lai, bất kỳ chiến lược nào cũng có khả năng thua lỗ liên tục. Khi môi trường thị trường thay đổi, hiệu quả của chiến lược cũng sẽ được điều chỉnh cho phù hợp.

Mã nguồn chiến lược
/*backtest
start: 2026-01-01 00:00:00
end: 2026-03-19 00:00:00
period: 1h
basePeriod: 1h
exchanges: [{"eid":"Futures_Binance","currency":"ETH_USDT","balance":500000}]
*/

//@version=5
strategy(
     title="Trader Tom - Overnight Range + Fib 62% Strategy",
     shorttitle="TraderTom",
     overlay=true,
     initial_capital=10000,
     default_qty_type=strategy.percent_of_equity,
     default_qty_value=10,
     commission_type=strategy.commission.percent,
     commission_value=0.1,
     slippage=2
     )

// ─────────────────────────────────────────
// INPUTS
// ─────────────────────────────────────────

// Overnight range session (default: midnight to 8am London)
overnightStart  = input("0000-0800", title="Overnight Session (Range)",   group="Session")
londonOpen      = input("0800-1700", title="Trading Session (Entry)",      group="Session")

// Lost Momentum settings
maLen           = input.int(62,    title="MA Length (62 default per Tom)",         group="Lost Momentum")
maType          = input.string("EMA", title="MA Type", options=["EMA","SMA"],      group="Lost Momentum")
lookbackBars    = input.int(8,     title="Min bars back for previous low/high",    group="Lost Momentum")

// Risk Management
slPercent       = input.float(1.0, title="Stop Loss %",    group="Risk Management", step=0.1)
tpMulti         = input.float(2.0, title="TP Multiplier (R:R)", group="Risk Management", step=0.1)
useTrail        = input.bool(true,  title="Use Trailing Stop",  group="Risk Management")

// Display
showRange       = input.bool(true,  title="Show Overnight Range",    group="Display")
showFib         = input.bool(true,  title="Show Fib 62% Level",      group="Display")
showMA          = input.bool(true,  title="Show MA on Chart",         group="Display")

// ─────────────────────────────────────────
// MA CALCULATION
// ─────────────────────────────────────────
maValue = maType == "EMA" ? ta.ema(close, maLen) : ta.sma(close, maLen)

// ─────────────────────────────────────────
// OVERNIGHT RANGE (High & Low)
// ─────────────────────────────────────────
isOvernight  = not na(time(timeframe.period, overnightStart))
isTrading    = not na(time(timeframe.period, londonOpen))

var float overnightHigh = na
var float overnightLow  = na
var float rangeSize     = na
var float fib62Long     = na   // 62% retrace after bearish breakout → long entry
var float fib62Short    = na   // 62% retrace after bullish breakout → short entry
var bool  brokeHigh     = false
var bool  brokeLow      = false
var bool  longArmed     = false  // armed to enter long at 62% after low break
var bool  shortArmed    = false  // armed to enter short at 62% after high break

// Reset range at start of each new day
if ta.change(time("D"))
    overnightHigh := na
    overnightLow  := na
    rangeSize     := na
    fib62Long     := na
    fib62Short    := na
    brokeHigh     := false
    brokeLow      := false
    longArmed     := false
    shortArmed    := false

// Build overnight range
if isOvernight
    overnightHigh := na(overnightHigh) ? high : math.max(overnightHigh, high)
    overnightLow  := na(overnightLow)  ? low  : math.min(overnightLow,  low)
    rangeSize     := overnightHigh - overnightLow

// ─────────────────────────────────────────
// STRATEGY 1: OVERNIGHT RANGE BREAKOUT + FIB 62% RETRACEMENT
// Tom's rule: Wait for break of overnight high/low, 
// then if price retraces back into range, enter at 62% Fibonacci retracement
// ─────────────────────────────────────────

if isTrading and not na(overnightHigh) and not na(overnightLow)

    // Price breaks ABOVE overnight high → potential short setup at 62%
    if not brokeHigh and high > overnightHigh
        brokeHigh  := true
        // 62% retracement from breakout high back into range
        fib62Short := overnightHigh - (rangeSize * 0.62)
        shortArmed := true

    // Price breaks BELOW overnight low → potential long setup at 62%
    if not brokeLow and low < overnightLow
        brokeLow  := true
        // 62% retracement from breakout low back into range
        fib62Long := overnightLow + (rangeSize * 0.62)
        longArmed := true

    // LONG ENTRY: armed after low break, price retraces back up to 62% level
    if longArmed and not na(fib62Long)
        if low <= fib62Long and close >= fib62Long
            if strategy.position_size == 0
                strategy.entry("Tom Long", strategy.long, comment="▲ Fib62 Long")
            longArmed := false  // disarm after entry

    // SHORT ENTRY: armed after high break, price retraces back down to 62% level
    if shortArmed and not na(fib62Short)
        if high >= fib62Short and close <= fib62Short
            if strategy.position_size == 0
                strategy.entry("Tom Short", strategy.short, comment="▼ Fib62 Short")
            shortArmed := false

// ─────────────────────────────────────────
// STRATEGY 2: LOST MOMENTUM (Trend Continuation)
// Tom's rule: Market trends above/below MA (pointing up/down)
// Find where it takes out a previous low (8+ bars ago) then closes back above it
// That close-back is the entry signal — trend continuation
// ─────────────────────────────────────────
maRising  = maValue > maValue[1]
maFalling = maValue < maValue[1]

// Find previous low that is at least lookbackBars ago
prevLow  = ta.lowest(low, lookbackBars)[1]
prevHigh = ta.highest(high, lookbackBars)[1]

// Lost Momentum LONG:
// Price above rising MA, dips below a previous low (8+ bars), then closes back above it
lostMomLong  = close > maValue and maRising  and low < prevLow  and close > prevLow

// Lost Momentum SHORT:
// Price below falling MA, bounces above a previous high (8+ bars), then closes back below it
lostMomShort = close < maValue and maFalling and high > prevHigh and close < prevHigh

if lostMomLong and strategy.position_size == 0
    strategy.entry("Tom LM Long", strategy.long, comment="▲ LostMom Long")

if lostMomShort and strategy.position_size == 0
    strategy.entry("Tom LM Short", strategy.short, comment="▼ LostMom Short")

// ─────────────────────────────────────────
// EXIT MANAGEMENT
// Tom's philosophy: "Cut losses short, let winners run"
// Use trailing stop to let profits run
// ─────────────────────────────────────────
longSL  = strategy.position_avg_price * (1 - slPercent / 100)
shortSL = strategy.position_avg_price * (1 + slPercent / 100)
longTP  = strategy.position_avg_price * (1 + (slPercent * tpMulti) / 100)
shortTP = strategy.position_avg_price * (1 - (slPercent * tpMulti) / 100)

if strategy.position_size > 0
    if useTrail
        strategy.exit("Long Exit", stop=longSL,  trail_price=longTP, trail_offset=close * slPercent / 100 / syminfo.mintick)
    else
        strategy.exit("Long Exit", stop=longSL,  limit=longTP)

if strategy.position_size < 0
    if useTrail
        strategy.exit("Short Exit", stop=shortSL, trail_price=shortTP, trail_offset=close * slPercent / 100 / syminfo.mintick)
    else
        strategy.exit("Short Exit", stop=shortSL, limit=shortTP)

// ─────────────────────────────────────────
// VISUALS
// ─────────────────────────────────────────

// MA line
plot(showMA ? maValue : na, title="Tom's MA (62)", color=color.new(color.blue, 0), linewidth=2)

// Overnight High/Low lines
plot(showRange and not na(overnightHigh) ? overnightHigh : na, title="Overnight High", color=color.new(color.orange, 0), linewidth=1, style=plot.style_linebr)
plot(showRange and not na(overnightLow)  ? overnightLow  : na, title="Overnight Low",  color=color.new(color.orange, 0), linewidth=1, style=plot.style_linebr)

// Fib 62% levels
plot(showFib and not na(fib62Long)  ? fib62Long  : na, title="Fib 62% Long Entry",  color=color.new(color.teal, 0), linewidth=1, style=plot.style_linebr)
plot(showFib and not na(fib62Short) ? fib62Short : na, title="Fib 62% Short Entry", color=color.new(color.red,  0), linewidth=1, style=plot.style_linebr)

// Entry signals
plotshape(lostMomLong,  title="Lost Mom Long",  style=shape.triangleup,   location=location.belowbar, color=color.new(color.teal, 0), size=size.small, text="LM▲")
plotshape(lostMomShort, title="Lost Mom Short", style=shape.triangledown,  location=location.abovebar, color=color.new(color.red,  0), size=size.small, text="LM▼")

// Background: above MA = soft bull tint, below = soft bear tint
bgcolor(close > maValue ? color.new(color.teal, 96) : color.new(color.red, 96), title="Trend Background")