混合图表的一个复杂例子

Author: Zero, Date: 2020-04-11 12:15:25
Tags: Chart

更多需求请直接查询 Highchart官方Highchart第三方中文文档

img


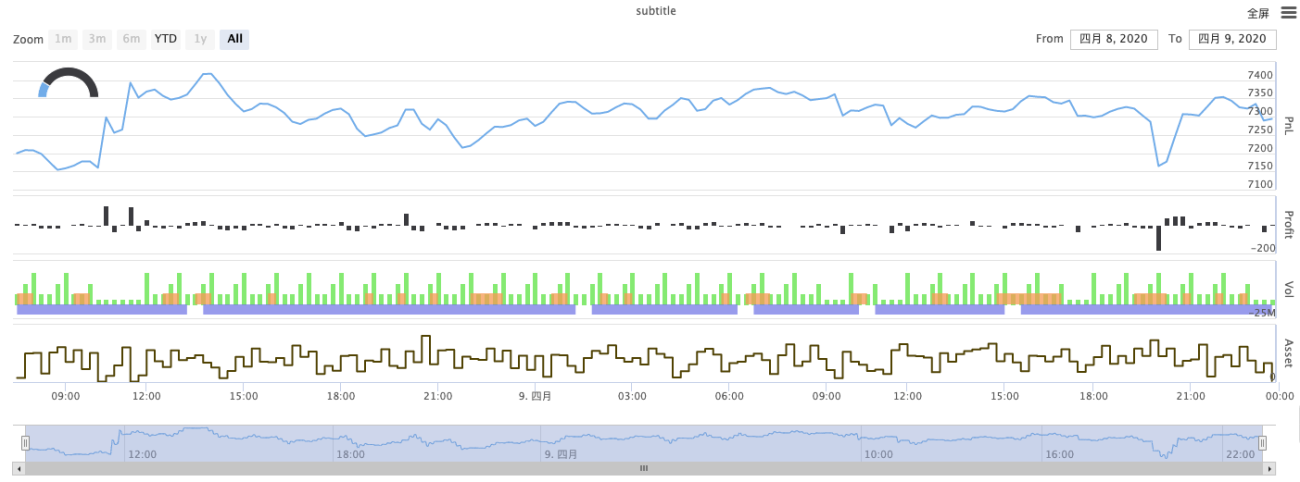
/*backtest
start: 2020-03-11 00:00:00
end: 2020-04-09 23:59:00
period: 1d
exchanges: [{"eid":"Bitfinex","currency":"BTC_USD"}]
*/

var chartCfg = {
    subtitle: {
        text: "subtitle",
    },
    yAxis: [{
        height: "40%",
        lineWidth: 2,
        title: {
            text: 'PnL',
        },
        tickPixelInterval: 20,
        minorGridLineWidth: 1,
        minorTickWidth: 0,
        opposite: true,
        labels: {
            align: "right",
            x: -3,
        }
    }, {
        title: {
            text: 'Profit',
        },
        top: "42%",
        height: "18%",
        offset: 0,
        lineWidth: 2
    }, {
        title: {
            text: 'Vol',
        },
        top: '62%',
        height: '18%',
        offset: 0,
        lineWidth: 2
    }, {
        title: {
            text: 'Asset',
        },
        top: '82%',
        height: '18%',
        offset: 0,
        lineWidth: 2
    }],
    series: [{
        name: 'PnL',
        data: [],
        id: 'primary',
        tooltip: {
            xDateFormat: '%Y-%m-%d %H:%M:%S'
        },
        yAxis: 0
    }, {
        type: 'column',
        lineWidth: 2,
        name: 'Profit',
        data: [],
        yAxis: 1,
    }, {
        type: 'column',
        name: 'Trade',
        data: [],
        yAxis: 2
    }, {
        type: 'area',
        step: true,
        lineWidth: 0,
        name: 'Long',
        data: [],
        yAxis: 2
    }, {
        type: 'area',
        step: true,
        lineWidth: 0,
        name: 'Short',
        data: [],
        yAxis: 2
    }, {
        type: 'line',
        step: true,
        color: '#5b4b00',
        name: 'Asset',
        data: [],
        yAxis: 3
    }, {
        type: 'pie',
        innerSize: '70%',
        name: 'Random',
        data: [],
        center: ['3%', '6%'],
        size: '15%',
        dataLabels: {
            enabled: false
        },
        startAngle: -90,
        endAngle: 90,
    }],
};

function main() {
    let c = Chart(chartCfg);
    let preTicker = null;
    while (true) {
        let t = exchange.GetTicker();
        
        c.add(0, [t.Time, t.Last]); // PnL
        c.add(1, [t.Time, preTicker ? t.Last - preTicker.Last : 0]); // profit
        let r = Math.random();
        var pos = parseInt(t.Time/86400);
        c.add(2, [t.Time, pos/2]); // Vol
        c.add(3, [t.Time, r > 0.8 ? pos : null]); // Long
        c.add(4, [t.Time, r < 0.8 ? -pos : null]); // Short
        c.add(5, [t.Time, Math.random() * 100]); // Asset
        // update pie
        chartCfg.series[chartCfg.series.length-1].data = [
            ["A", Math.random()*100],
            ["B", Math.random()*100],
         ];
        c.update(chartCfg)
        preTicker = t;
    }
}

Related

More

Zero 回测有的,实盘没有

Johnny 是不是有最大插入值限制?跑了下只能显示最多一天的数据

fmzero 图形是否有API用来控制曲线/图形的显示与隐藏