Optimized Trend Tracker

A brand new indicator from the developer of MOST (Moving Stop Loss) indicator Anıl Özekşi.
Optimized Trend Tracker OTT is an indicator that provides traders to find an existing trend or in another words to ser which side of the current trend we are on.
We are under the effect of the uptrend in cases where the prices are above OTT ,
under the influence of a downward trend, when prices are below OTT
it is possible to say that we are.
The first parameter in the OTT indicator set by the two parameters is the period/length.
OTT will be much sensitive to trend movements if it is smaller. And vice versa, will be less sensitive when it is longer.
As the period increases it will become less sensitive to little trends and price actions.
In this way, your choice of period, will be closely related to which of the sort of trends you are interested in.
The OTT percent parameter in OTT is an optimization coefficient. Just like in the period
small values are better at capturing short term fluctuations, while large values
will be more suitable for long-term trends.
In addition, when OTT is used with the support line in it, buy and sell signals
it will become a producing indicator.
You can use OTT default alarms and Buy Sell signals like:
1-
BUY when Prices are above OTT
SELL when Prices are below OTT
2-
BUY when OTT support Line crosses over OTT line.
SELL when OTT support Line crosses under OTT line.
3-
BUY when OTT line is Green and makes higher highs.
SELL when OTT line is Red and makes lower lows.
Note: A small coverage with English subtitles will be available on my Youtube Channel soon.
回测
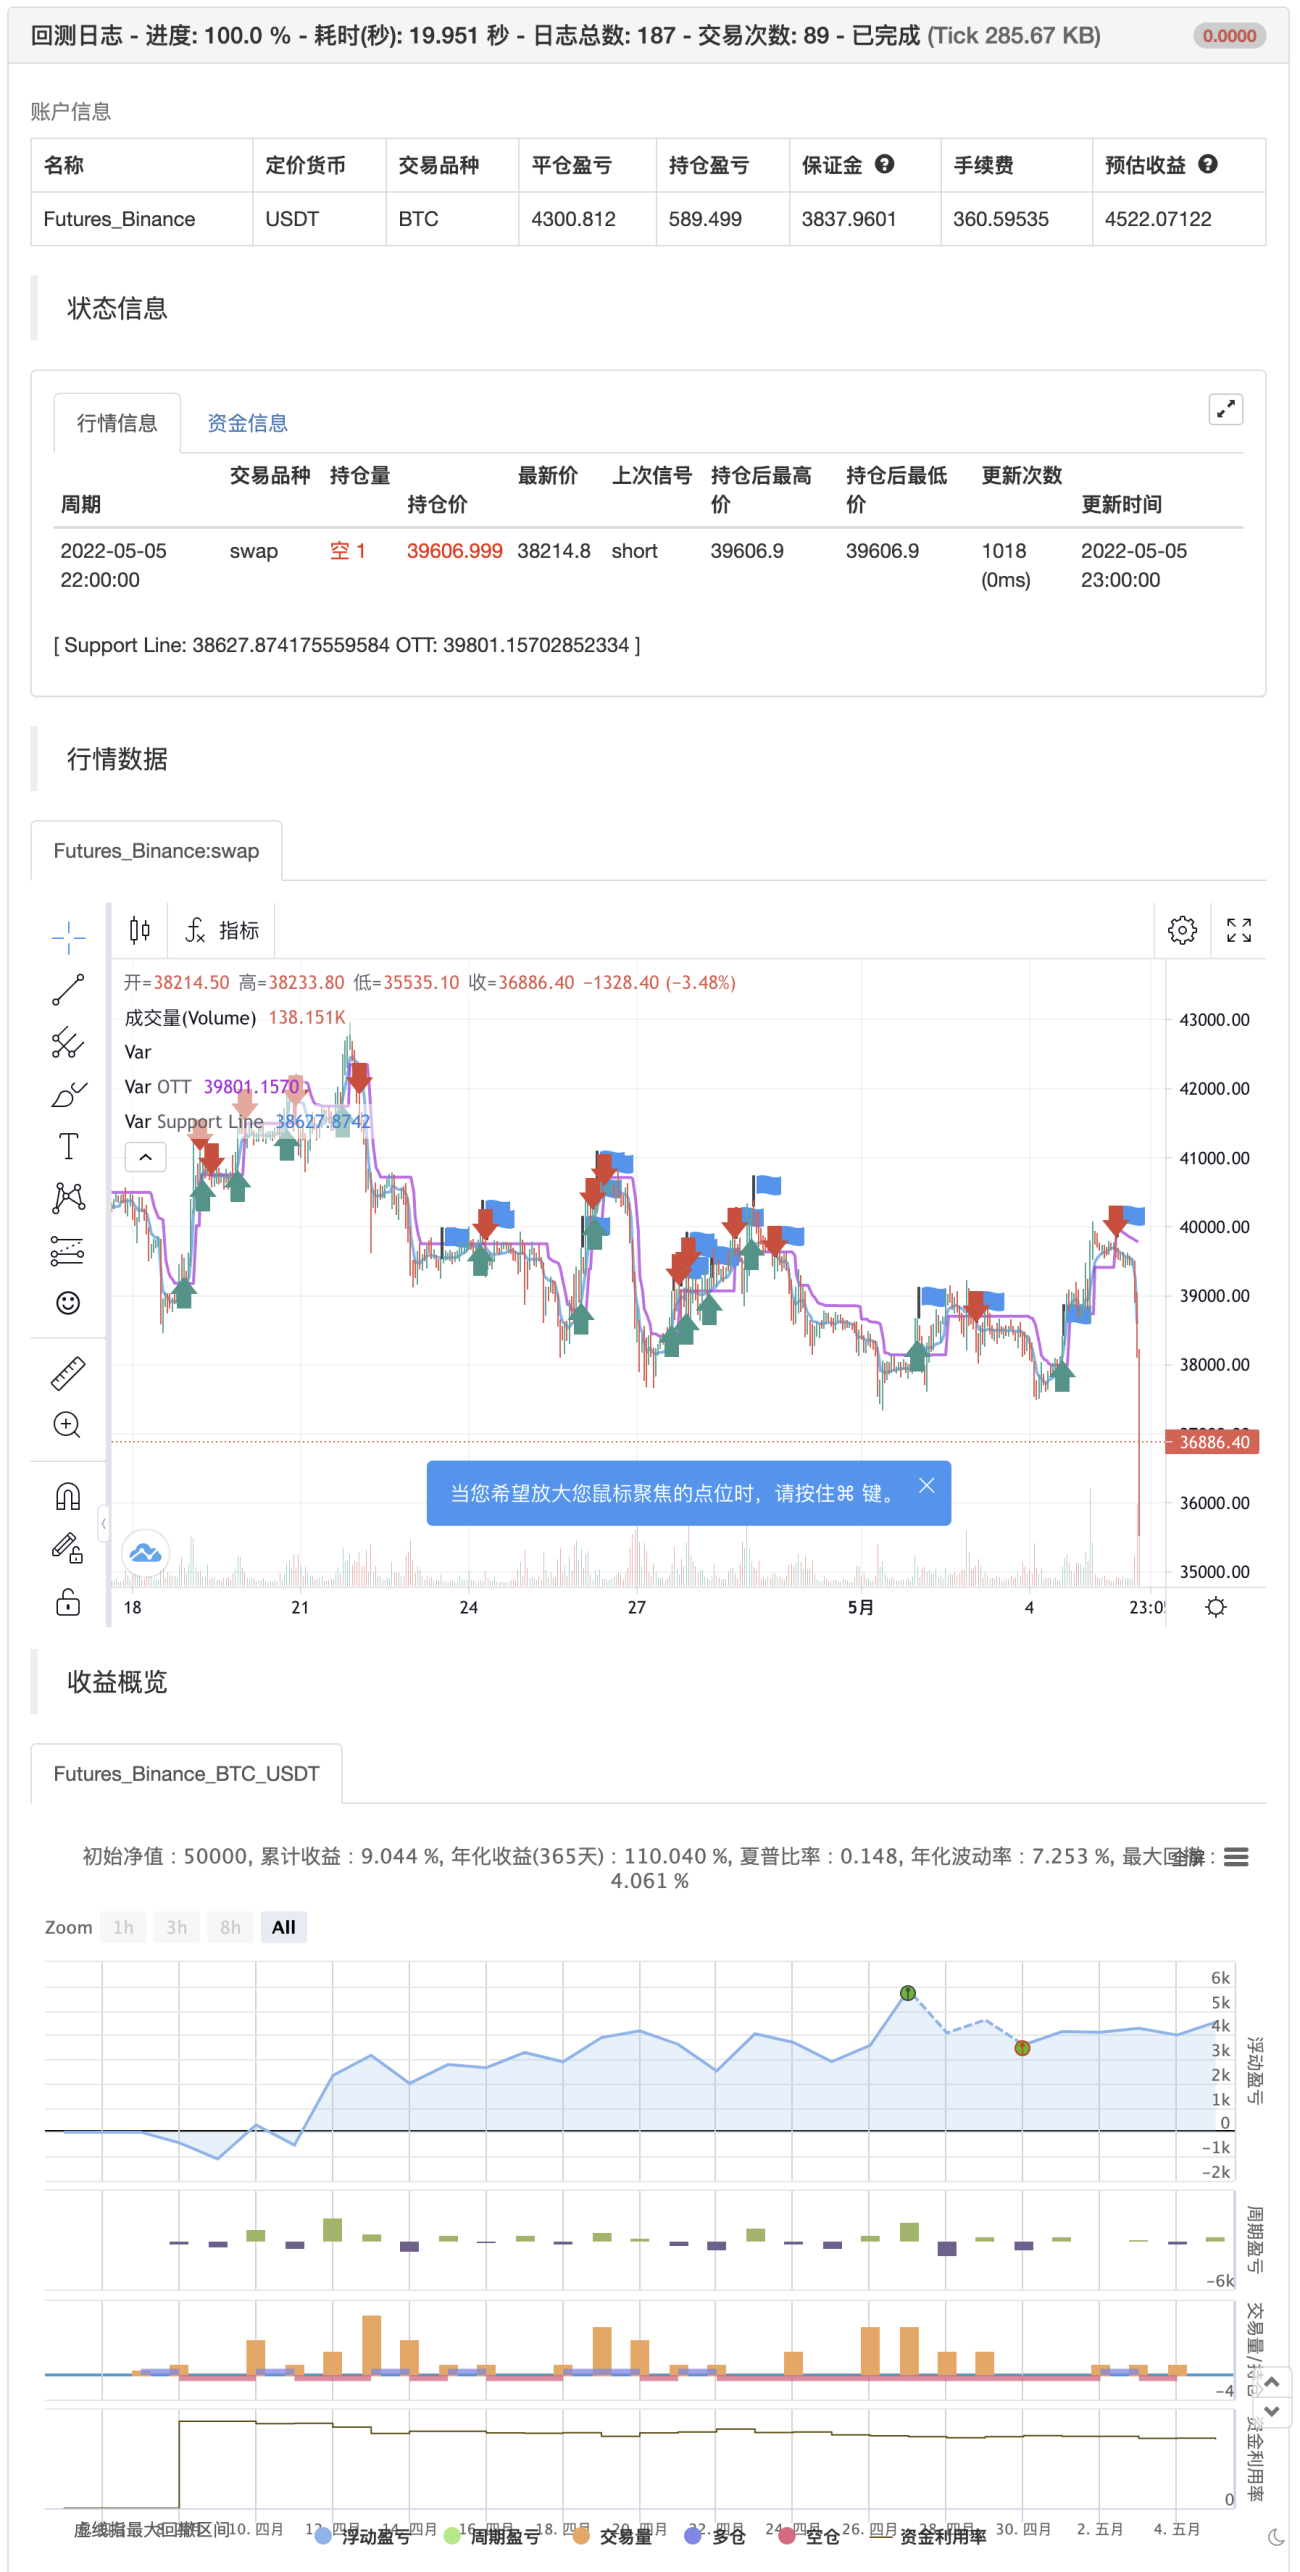
/*backtest
start: 2022-04-06 00:00:00
end: 2022-05-05 23:59:00
period: 1h
basePeriod: 15m
exchanges: [{"eid":"Futures_Binance","currency":"BTC_USDT"}]
*/
//@version=4
// This source code is subject to the terms of the Mozilla Public License 2.0 at https://mozilla.org/MPL/2.0/
// © KivancOzbilgic

//created by: @Anil_Ozeksi- 1