Nick Rypock Trailing Reverse (NRTR)

Author: ChaoZhang, Date: 2022-05-25 18:14:32
Tags: NRTR

This indicator was invented in 2001 by Konstantin Kopyrkin. The name “Nick Rypock” is derived from his surname reading in the opposite direction:

Kopyrkin -> Kopyr Kin -> Kin Kopyr -> Nik Rypok

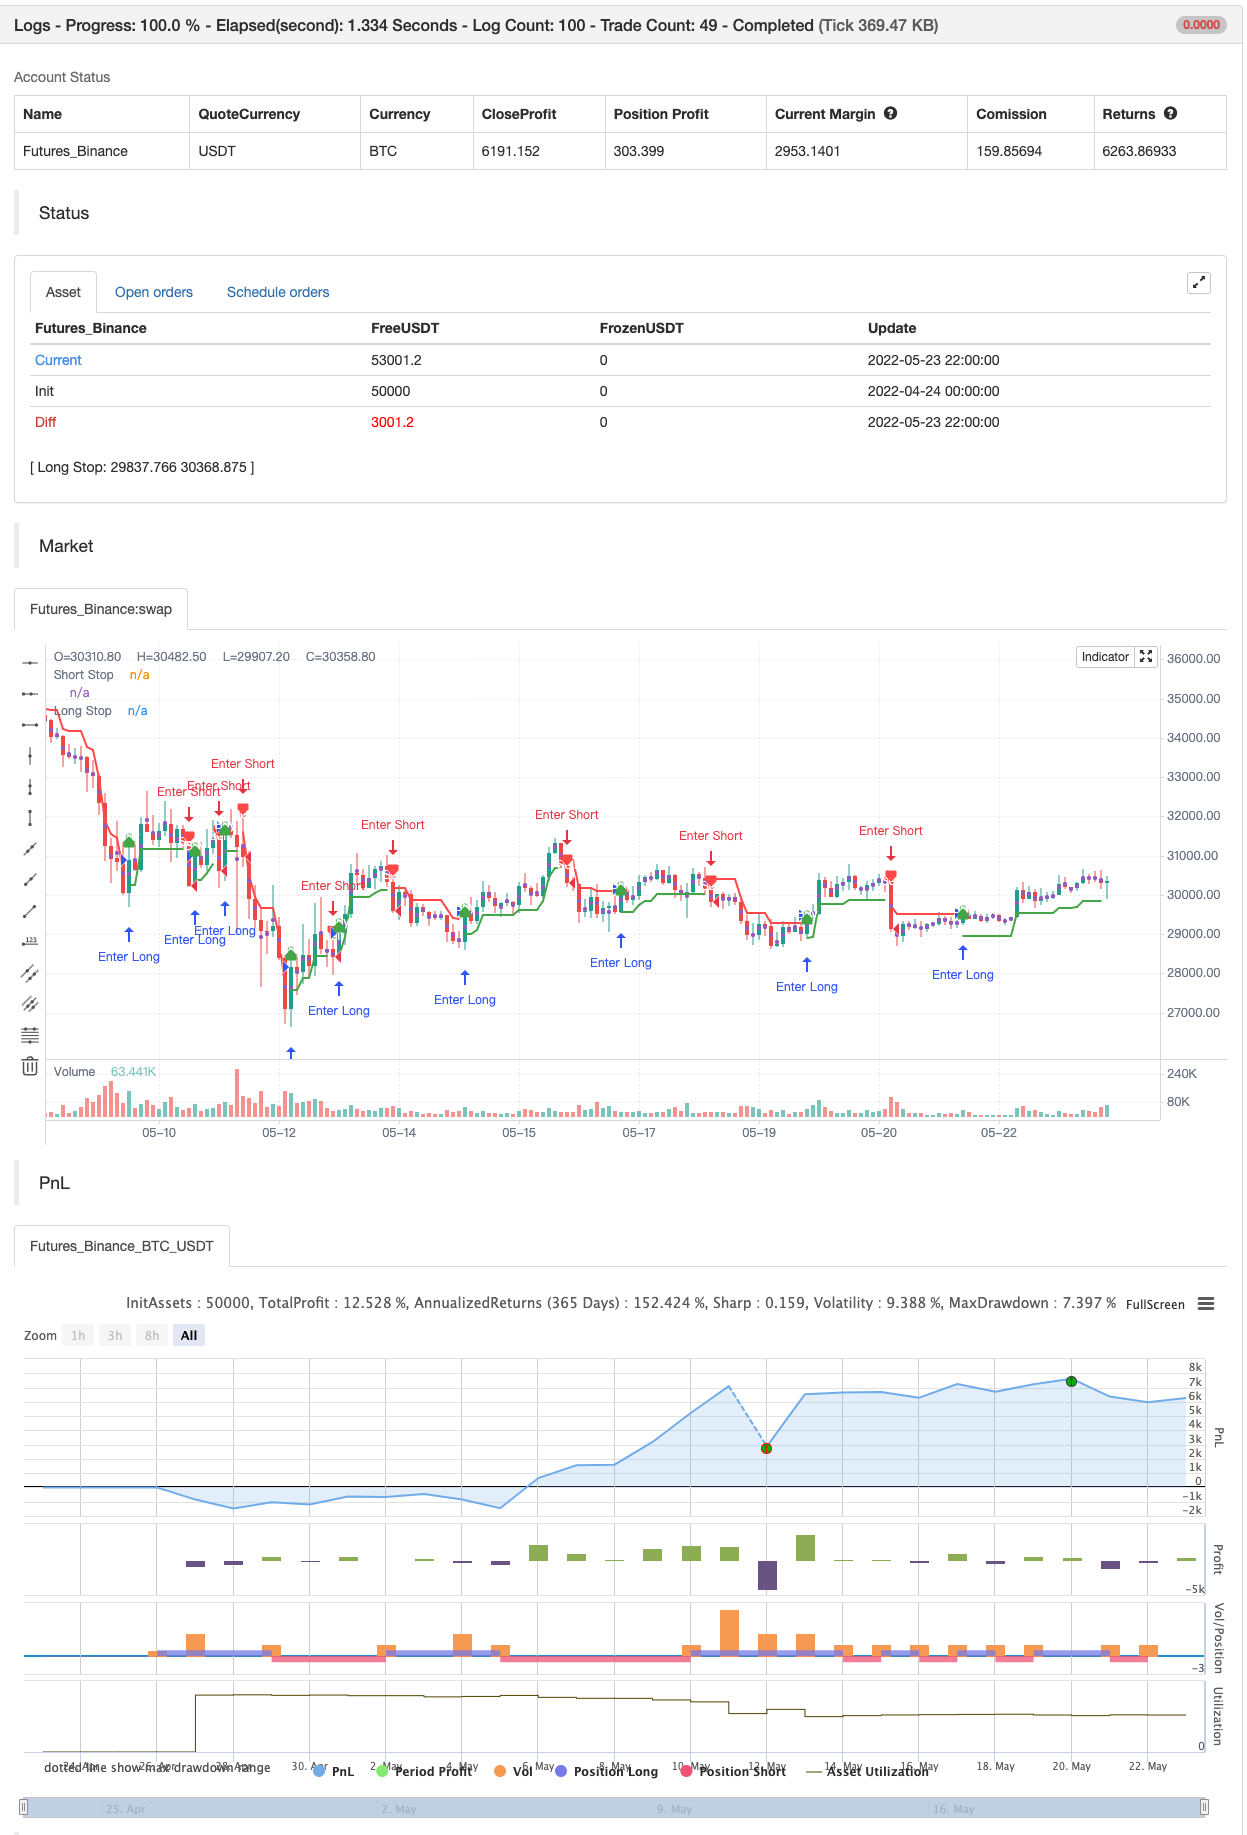
The idea of the indicator is similar to the Chandelier Exit , but doesn’t involve ATR component and uses a percentage instead.

A dynamic price channel is used to calculate the NRTR. The calculations involve only those prices that are included in the current trend and exclude the extremes related to the previous trend. The indicator is always at the same distance (in percent) from the extremes reached by prices (below the maximum peak for the current uptrend, above the minimum bottom for the current downtrend).

backtest

img


/*backtest
start: 2022-04-24 00:00:00
end: 2022-05-23 23:59:00
period: 2h
basePeriod: 15m
exchanges: [{"eid":"Futures_Binance","currency":"BTC_USDT"}]
*/

//@version=4
// Copyright (c) 2021-present, Alex Orekhov (everget)
study("Nick Rypock Trailing Reverse", shorttitle="NRTR", overlay=true)

k = input(title="Coefficient of Correction, %", type=input.float, minval=0, maxval=100, step=0.1, defval=2)
showLabels = input(title="Show Buy/Sell Labels ?", type=input.bool, defval=true)
applyRibbon = input(title="Apply Ribbon ?", type=input.bool, defval=true)

var int trend = 0
var float hp = close
var float lp = close
float nrtr = close

percentage = k * 0.01

if trend >= 0
	if close > hp
		hp := close
		hp
	nrtr := hp * (1 - percentage)
	if close <= nrtr
		trend := -1
		lp := close
		nrtr := lp * (1 + percentage)
		nrtr
else
	if close < lp
		lp := close
		lp
	nrtr := lp * (1 + percentage)
	if close > nrtr
		trend := 1
		hp := close
		nrtr := hp * (1 - percentage)
		nrtr

var color longColor = color.green
var color shortColor = color.red
var color textColor = color.white

longStopPlot = plot(trend == 1 ? nrtr : na, title="Long Stop", style=plot.style_linebr, linewidth=2, color=longColor)
buySignal = trend == 1 and trend[1] == -1
plotshape(buySignal ? nrtr : na, title="Long Stop Start", location=location.absolute, style=shape.circle, size=size.tiny, color=longColor, transp=0)
plotshape(buySignal and showLabels ? nrtr : na, title="Buy Label", text="Buy", location=location.absolute, style=shape.labelup, size=size.tiny, color=longColor, textcolor=textColor, transp=0)

shortStopPlot = plot(trend == 1 ? na : nrtr, title="Short Stop", style=plot.style_linebr, linewidth=2, color=shortColor)
sellSignal = trend == -1 and trend[1] == 1
plotshape(sellSignal ? nrtr : na, title="Short Stop Start", location=location.absolute, style=shape.circle, size=size.tiny, color=shortColor, transp=0)
plotshape(sellSignal and showLabels ? nrtr : na, title="Sell Label", text="Sell", location=location.absolute, style=shape.labeldown, size=size.tiny, color=shortColor, textcolor=textColor, transp=0)

midPricePlot = plot(ohlc4, title="", style=plot.style_circles, linewidth=0, display=display.none, editable=false)

longFillColor = applyRibbon ? (trend == 1 ? longColor : na) : na
shortFillColor = applyRibbon ? (trend == -1 ? shortColor : na) : na
fill(midPricePlot, longStopPlot, title="Long Ribbon", color=longFillColor)
fill(midPricePlot, shortStopPlot, title="Short Ribbon", color=shortFillColor)

changeCond = trend != trend[1]
alertcondition(changeCond, title="Alert: NRTR Direction Change", message="NRTR has changed direction!")
alertcondition(buySignal, title="Alert: NRTR Buy", message="NRTR Buy!")
alertcondition(sellSignal, title="Alert: NRTR Sell", message="NRTR Sell!")


if buySignal
    strategy.entry("Enter Long", strategy.long)
else if sellSignal
    strategy.entry("Enter Short", strategy.short)

Related

More