Dual Moving Average Reversal Trading Strategy

Overview
The dual moving average reversal trading strategy generates trading signals by calculating simple moving averages of two different periods - short term and long term. It goes long when the short period moving average crosses above the long period moving average, and goes short when the short period moving average crosses below the long period moving average. This strategy belongs to the trend following strategy category.
Strategy Logic
This strategy sets two simple moving averages with different period lengths through the input parameters, with the short period MA referred to as the fast line, and the long period MA referred to as the slow line. The fast line reacts faster to price changes and captures short term trends, while the slow line reacts slower to price changes and filters out short term market noise, capturing the major trend. When the fast line crosses above the slow line, it indicates the uptrend is strengthening and a long position is taken. When the fast line crosses below the slow line, it indicates the downtrend is strengthening and a short position is taken.
Specifically, the strategy calculates the two MAs using the sma() function, assigning the result to xSMA (slow line) and fast line. The MAs are calculated based on the close price. When the close price crosses above xSMA, a long position is taken. When the close price crosses below xSMA, a short position is taken. The strategy also sets a trading time range limit, so that trading signals are only generated within the specified time range.
Take profit and stop loss points are set for each trade, and profit is taken or stop loss triggered immediately when price reaches the take profit or stop loss level. Meanwhile, the strategy plots the price vs MA relationship on the bars using the barcolor function - bars are colored green during long positions, red during short positions, and blue when flat.
Advantage Analysis
- Using a dual MA system can effectively track trends and avoid being misled by short term market noise
- Combining fast and slow MAs can improve trading signal quality
- Take profit and stop loss points control risk for each trade
- Limiting trading time range avoids huge swings around major events
- Plotting trading signals on bars creates visual aid and improves intuitiveness
Risk Analysis
- Dual MA systems tend to generate more false signals, increasing trading frequency and costs
- MA parameters need to be set reasonably, otherwise smoothing effect suffers or too many missed opportunities
- MA systems have lag and may miss trend turning points
- Fixed take profit/stop loss may be too blunt and cannot adjust dynamically
- Limiting trading time range may miss opportunities in other periods
Risk can be reduced by adjusting MA parameters, optimizing take profit/stop loss strategy, removing time limitations or setting more reasonable trading time periods. Other indicators could also be incorporated as filter conditions to avoid too many false signals.
Optimization Directions
- Test different MA period combinations to find optimal parameters
- Consider dynamic trailing stop loss/profit, e.g. based on ATR
- Incorporate other indicators like MACD, KD etc as filter signals
- Optimize trading time range to capture more opportunities
- Combine with breakout strategy, looking for breakout signals around MAs
- Build dynamic exit mechanisms, actively stopping out when price enters range
Summary
The dual moving average reversal trading strategy overall is a simple and practical trend following strategy. It takes full advantage of the smoothing effect of MAs to identify trend direction, and uses fast/slow MAs to generate trading signals. The strategy is easy to implement with clear logic, suitable for beginners to grasp. However, it may generate excessive false signals and lag issues. Improvements can be made via parameter optimization, adding auxiliary indicators etc to make the strategy more robust. If used properly, this strategy can deliver steady profits and is worth comprehensive testing and optimization.
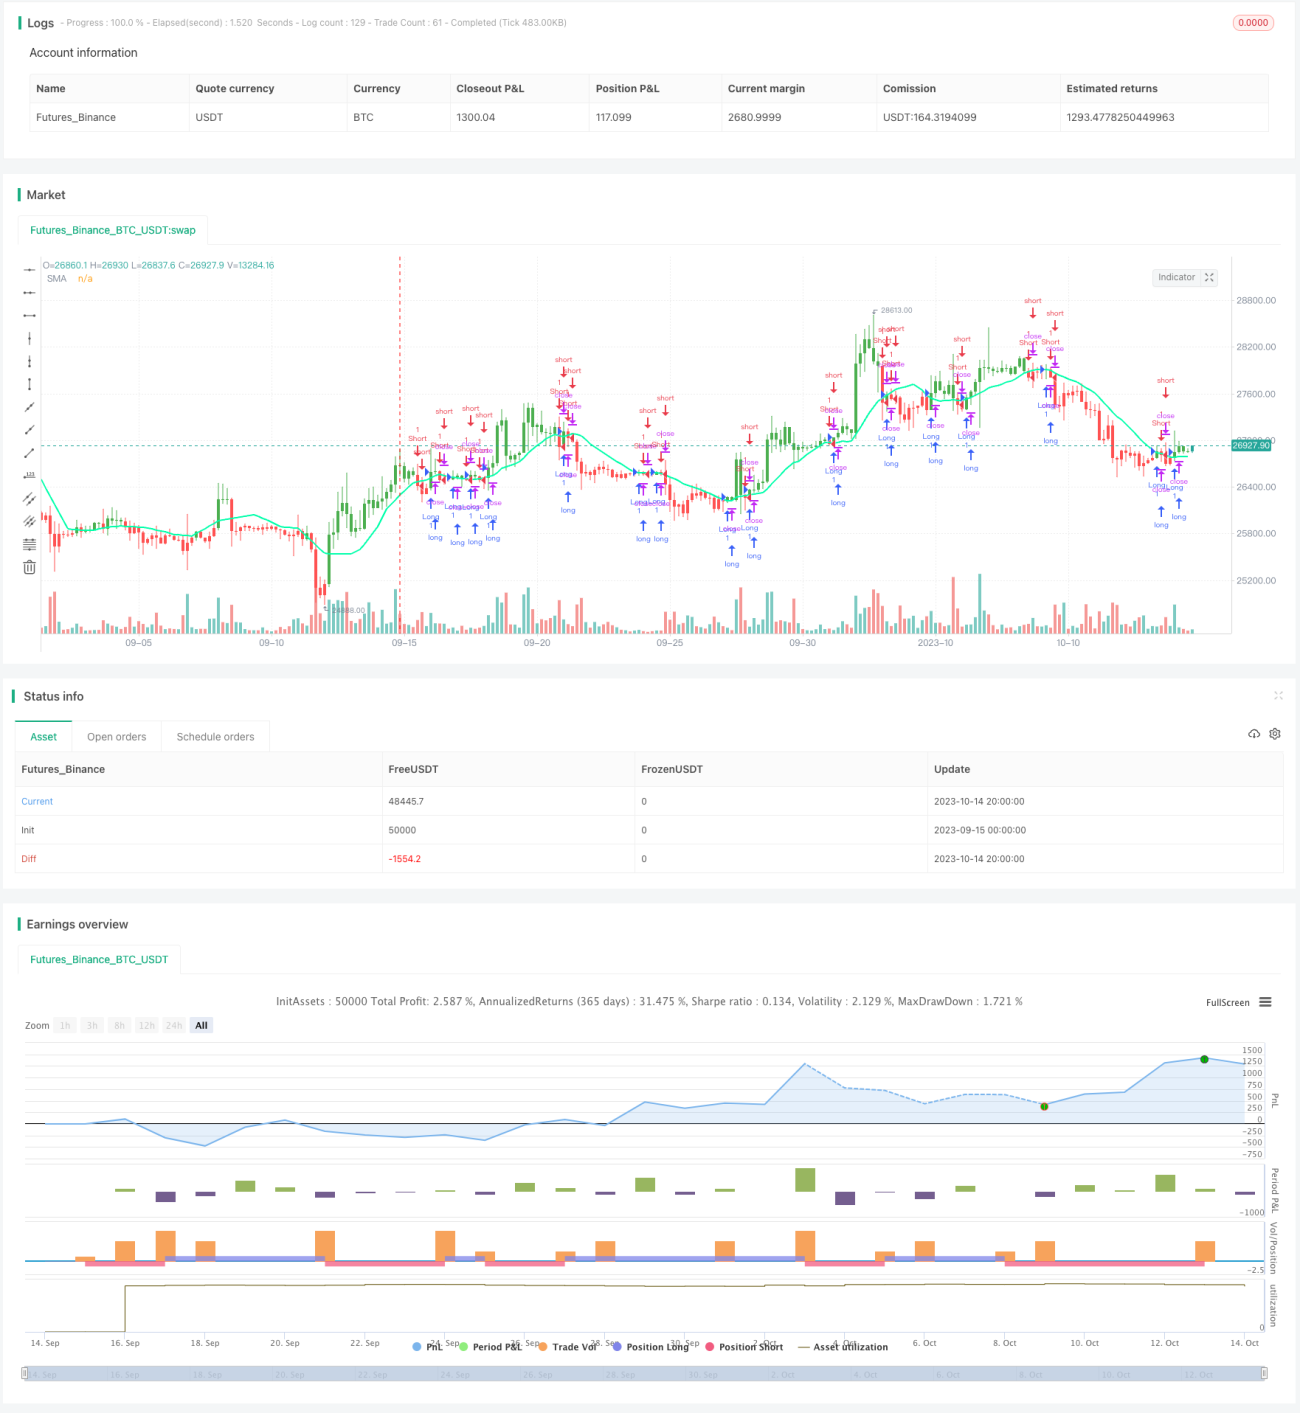
/*backtest
start: 2023-09-15 00:00:00
end: 2023-10-15 00:00:00
period: 4h
basePeriod: 15m
exchanges: [{"eid":"Futures_Binance","currency":"BTC_USDT"}]
*/

// This source code is subject to the terms of the Mozilla Public License 2.0 at https://mozilla.org/MPL/2.0/
// © HPotter
//  Simple SMA strategy
//- 1