Dual EMA Crossover Strategy

Overview
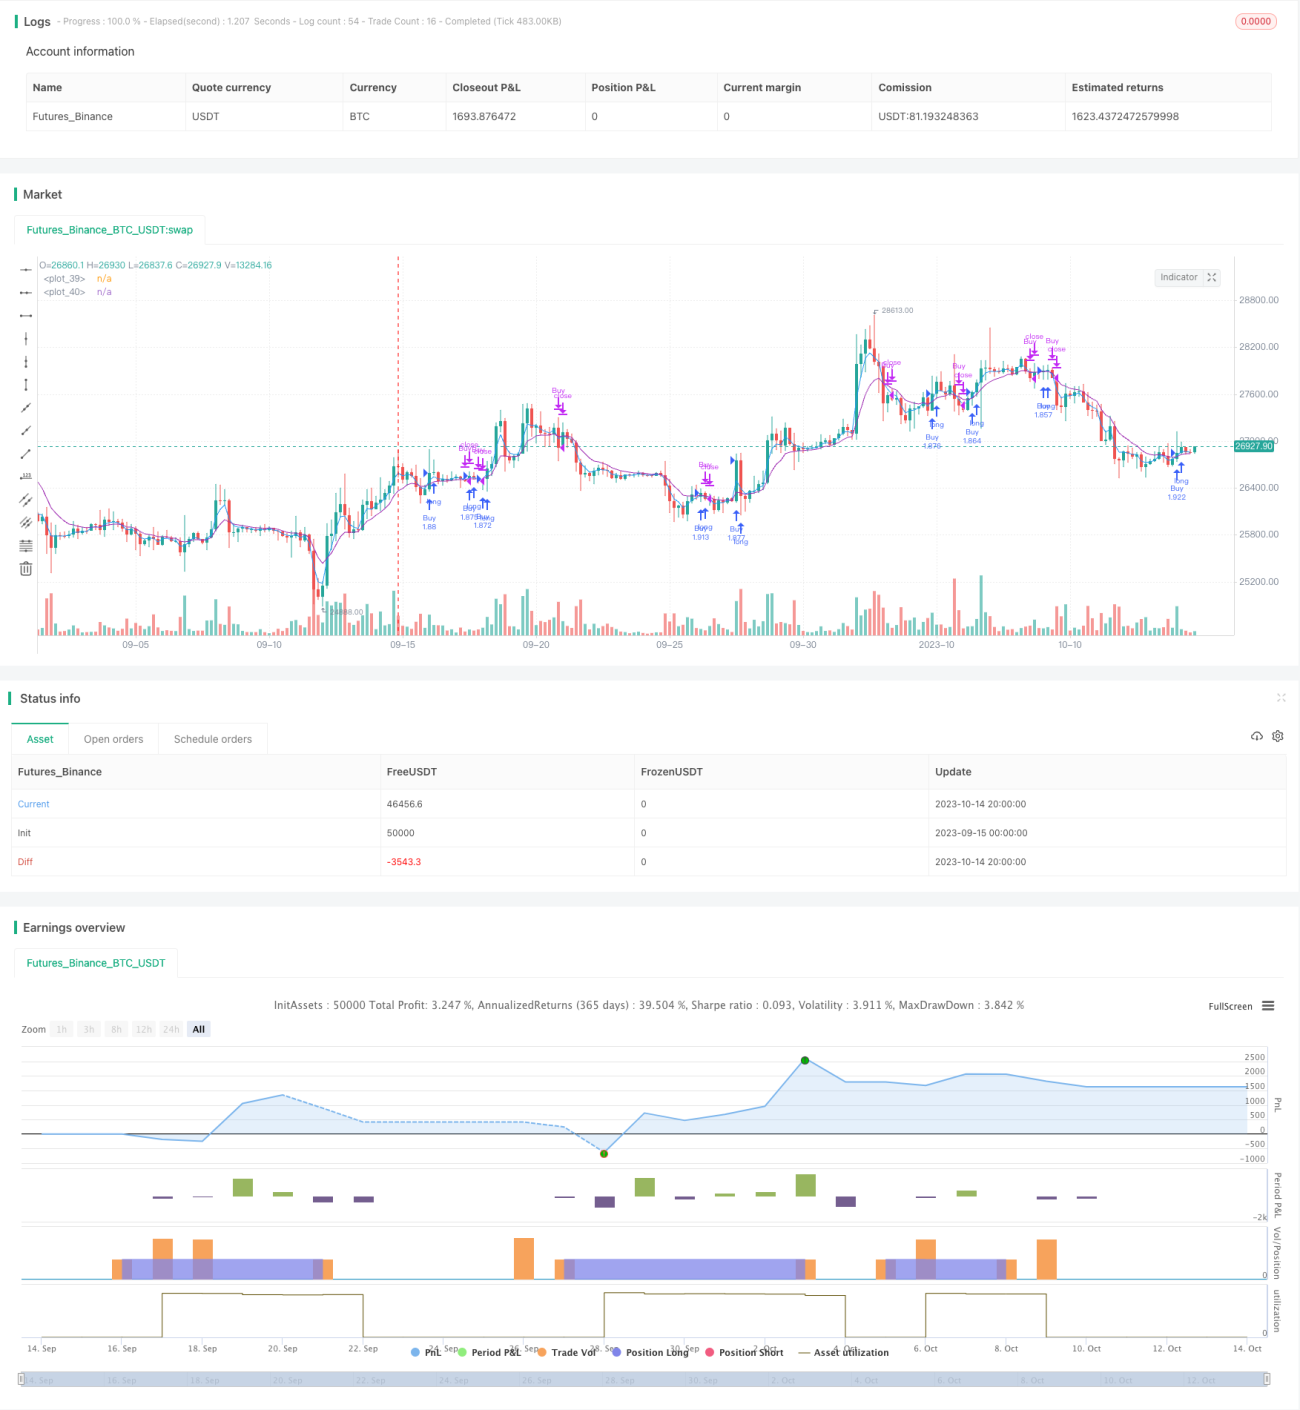
This is a dual EMA crossover trading strategy based on fast EMA and slow EMA indicators. The strategy generates long signals when the fast EMA crosses above the slow EMA, and closes long positions when the fast EMA crosses below the slow EMA. The strategy is simple and practical for medium-term trading.
Strategy Logic
The strategy is mainly implemented with the dual EMA indicators. The fast EMA has a shorter period to sensitively reflect price changes, while the slow EMA has a longer period to indicate long term trends.
When the fast EMA crosses above the slow EMA, a golden cross is formed, indicating upward price momentum in the short term for going long. When the fast EMA crosses below the slow EMA, a death cross is formed, showing downward momentum to close long positions.
Specifically, the strategy includes:
-
Input parameters for fast and slow EMA, including period, source etc.
-
Calculate fast EMA and slow EMA.
-
Define golden cross when fast EMA crosses above slow EMA.
-
Define death cross when fast EMA crosses below slow EMA.
-
Go long on golden crosses.
-
Close positions on death crosses.
-
Options for shorting and stop loss/profit taking.
-
Output buy and sell notifications.
With this simple dual EMA crossover system, the strategy can catch short-term trends for profits.
Advantage Analysis
The strategy has the following advantages:
-
The logic is simple and clear, easy to understand.
-
Only uses dual EMA, easy to implement.
-
Can catch short-term trends for swing profits.
-
Customizable EMA periods for different markets.
-
Option for shorting to control risks.
-
Option for stop loss/profit taking.
-
Buy/sell notifications for monitoring.
-
Easy to optimize EMA parameters for better profits.
Risk Analysis
There are also some risks:
-
Dual EMA may generate false signals causing unnecessary losses.
-
Improper stop loss setting may magnify losses.
-
High trading frequency increases costs and slippage risks.
-
Fixed EMA parameters cannot adapt to market changes.
-
Prone to chasing momentum, lose calm judgement.
-
Cannot identify trend reversal, may open reverse positions.
Corresponding risk management measures:
-
Optimize EMA parameters to reduce false signals.
-
Set proper stop loss to limit per trade loss.
-
Optimize EMA periods to reduce frequency.
-
Adjust EMA dynamically for different market stages.
-
Add trend indicators to avoid chasing momentum.
-
Identify major trend direction with trend tools.
Optimization Directions
The strategy can be optimized in the following aspects:
-
Dynamic optimization of EMA parameters for different markets.
-
Add stock filters to improve accuracy.
-
Incorporate volatility index to reduce position in low volatility environments.
-
Add volume confirmation for signals.
-
Set price levels, like 20SMA breakout before taking signals.
-
Improve stop loss and take profit strategies.
-
Add analysis of major trend to avoid trading against trend.
-
Continuously optimize the strategy with machine learning algorithms.
Summary
In summary, the dual EMA crossover strategy has simple and clear logic for capturing short-term trends, but also has some profit risks. We can manage risks by optimizing parameters, implementing stop loss/profit taking, filtering stocks, judging major trends etc, to steadily obtain satisfactory returns. The strategy can be incrementally improved with continuous research and enhancements.
/*backtest
start: 2023-09-15 00:00:00
end: 2023-10-15 00:00:00
period: 4h
basePeriod: 15m
exchanges: [{"eid":"Futures_Binance","currency":"BTC_USDT"}]
*/

//@version=4

strategy("EMA Strategy", shorttitle="EMA Strategy", overlay=true, pyramiding=0, default_qty_type=strategy.percent_of_equity, default_qty_value=100)
- 1